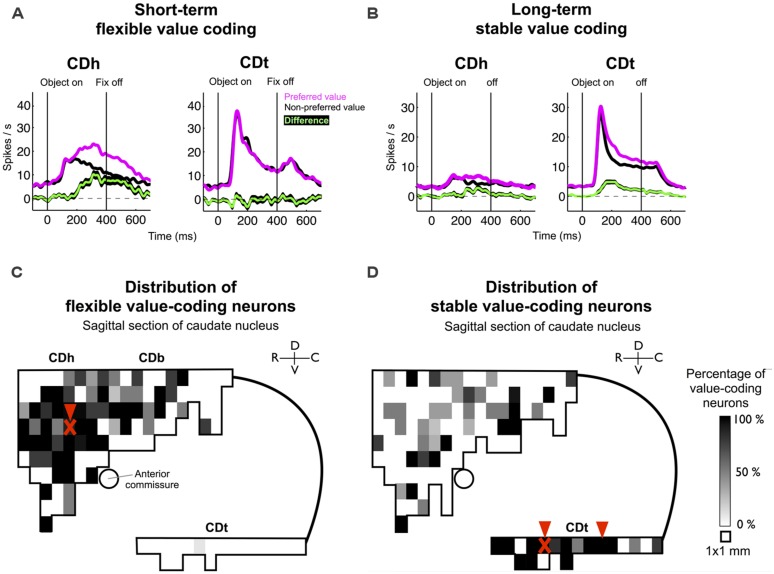
FIGURE 2.
Value-coding map of CD. (A) Average responses to the flexibly valued objects of neurons in CDh (n = 71) and CDt (n = 54). Neuronal responses were averaged for the neurons’ preferred values (magenta) and non-preferred values (black) using a cross-validation method. The green line indicates the mean of the differences between the preferred and non-preferred responses, and the black line behind the green line indicates the standard error of the differences (mean ± SE). (B) Average responses to the stably valued objects of neurons in CDh (n = 32) and CDt (n = 59). Same format as in (A). Data in (A,B) were obtained from monkey SM and ZO. (C) Value-coding map for short-term flexible values. (D) Value-coding map for long-term stable values. Data in (C,D) were obtained from monkey SM, ZO, and DW. A parasagittal plane across CD was divided into 1 mm × 1 mm areas, and the percentage of neurons that encoded each type of value significantly is shown for each area. Arrowheads indicate the injection sites of retrograde tracers. “X” marks indicate the locations of muscimol injections in monkey ZO which affected gaze orienting based on flexible and stable value learning (see Kim and Hikosaka, 2013).

