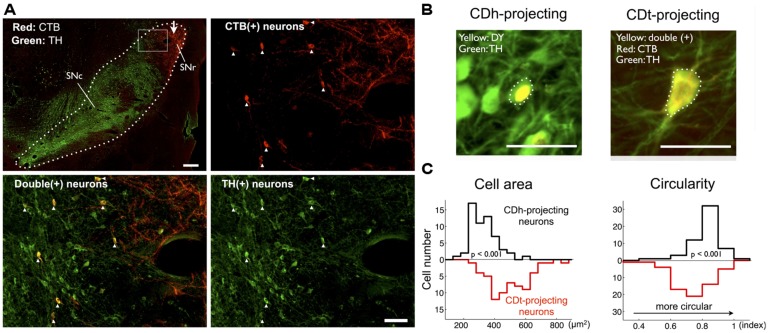
FIGURE 6.
CDt- and CDh-projecting neurons in SNc are dopaminergic. (A) Distributions of CDt-projecting neurons (CTB-positive, red) and DA neurons (TH-positive, green) in monkey SM. The CDt-projecting neurons were clustered in the dorsolateral part of SN (dotted line in top-left section; scale bar: 500 μm), and this area (box in top-left) is enlarged in the other sections: CTB-positive (top-right), TH-positive (bottom-right), and merged (bottom-left; scale bar: 100 μm). The merged image (bottom-left) shows double-labeled neurons (yellow signal). White arrow indicates CTB-labeled axon terminals of CDt neurons (top-left). (B) Difference in cell area and circularity of CDh- and CDt-projecting DA neurons. Sample CDh- and CDt-projecting DA neurons (top) in monkey ZO. DY signal was localized in the nucleus (top-left), while CTB and TH signals were distributed in the whole cell (top-right). Dotted line indicates cell soma. Scale bar: 50 μm. (C) Left: CDt-projecting DA neurons had larger cell areas than CDh-projecting neurons (mean value: 467.6 vs. 304.2 μm2; p < 0.001, ranksum test; bottom-left). Right: CDh-projecting DA neurons were more circular than CDt-projecting neurons (mean value: 0.69 vs. 0.77; p < 0.001, ranksum test; bottom-right).

