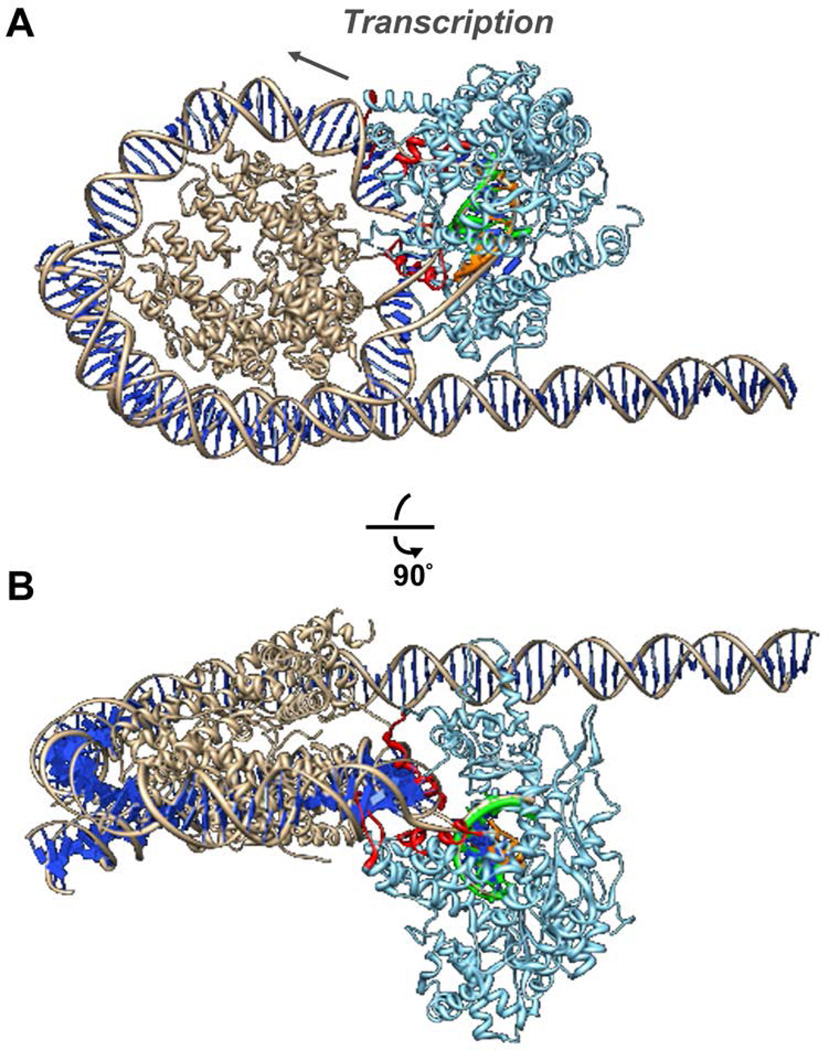
Figure 3. Structure of hypothetical intranucleosomal T7 EC+49 containing the Ø-loop: computational modeling.
A. Front and B. side views of the complex reveal steric clashes (in red) between T7 RNAP and nucleosomal DNA. The octamer and nucleosomal DNA helix (light brown), DNA bases (blue), RNA (green) and T7 RNAP (cyan) are shown. The DNA within the T7 EC is depicted in orange. The direction of transcription is indicated by arrow.

