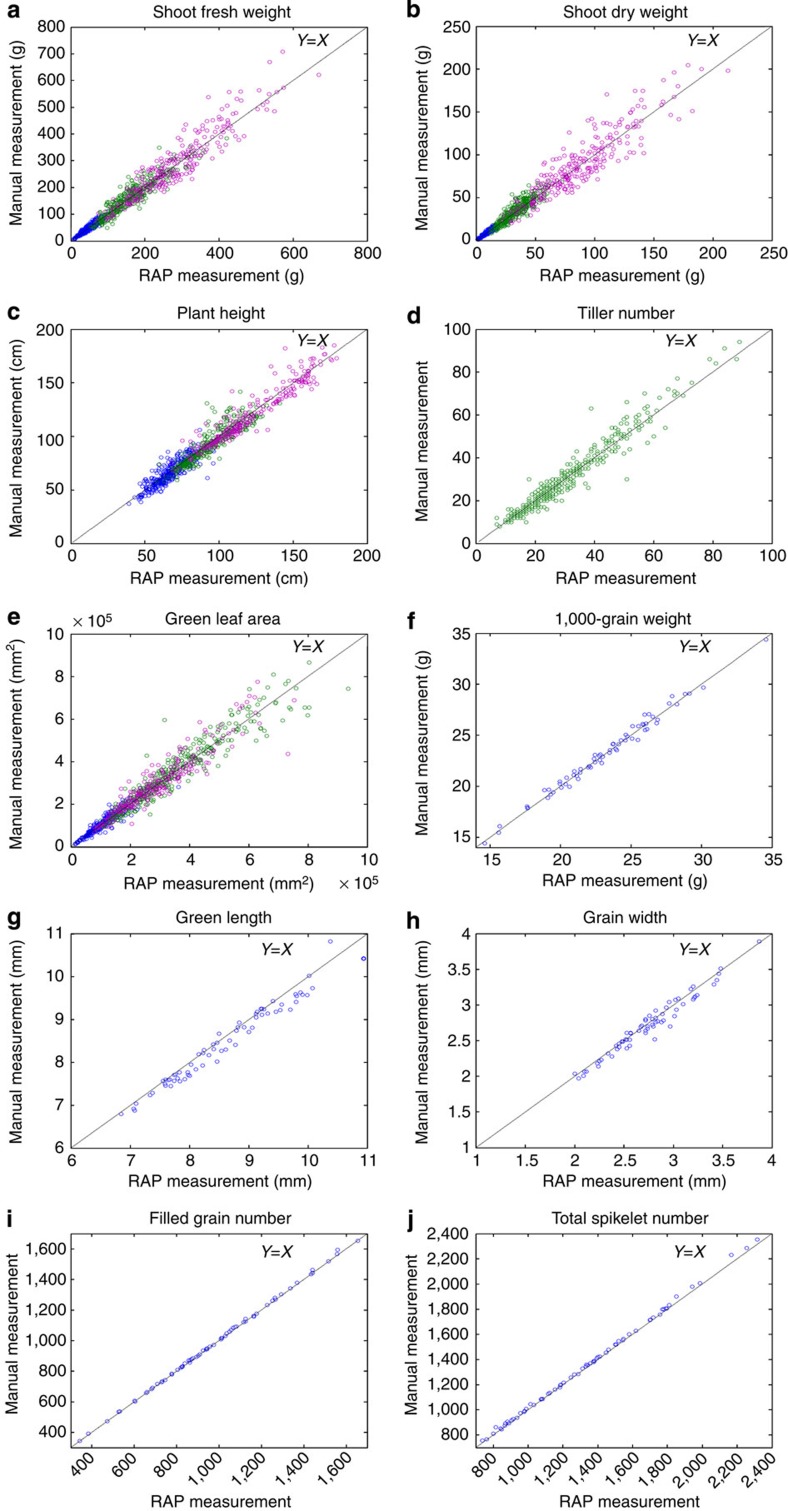
Figure 2. Scatter plots of 10 RAP/YTS measurements versus manual measurements.
(a) Shoot fresh weight, (b) shoot dry weight, (c) plant height, (d) tiller number and (e) green leaf area; the blue plots, green plots and purple plots represent the measurements at the late tillering stage, late booting stage and milk grain stage, respectively. Other scatter plots indicate the YTS measurements versus manual measurements for (f) 1,000-grain weight, (g) grain length, (h) grain width, (i) filled grain number and (j) total spikelet number. The details of the 10 rice phenotypic trait measurement accuracies are shown in Supplementary Table 1.

