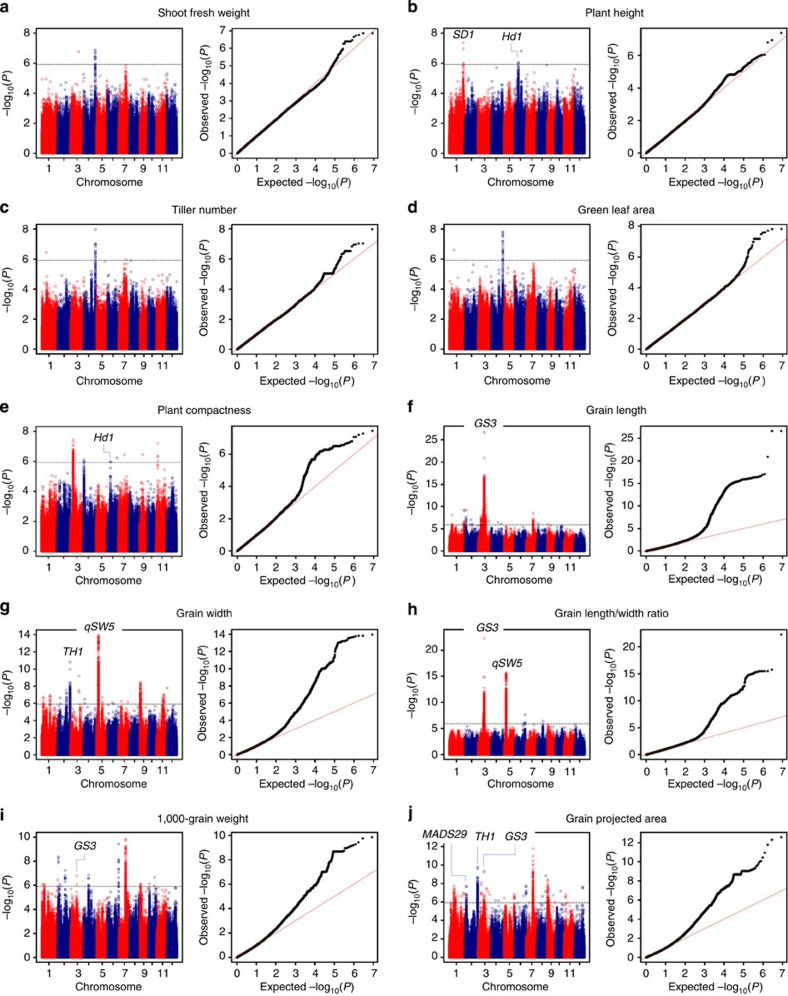
Figure 3. Genome-wide association studies of five traits at the late booting stage measured by the RAP and five yield-related traits measured by the YTS.
Manhattan plots (left) and quantile-quantile plots (right) for shoot fresh weight (a), plant height (b), tiller number (c), green leaf area (d) and plant compactness (e) measured by the RAP, and grain length (f), grain width (g), grain length/width ratio (h), 1,000-grain weight (i) and grain-projected area (j) measured by the YTS. The sample sizes are 402 for the five traits measured by RAP (a–e), and the sample sizes are 514 for five yield traits measured by YTS (f–j). The P values are computed from a likelihood ratio test with a mixed-model approach using the factored spectrally transformed linear mixed models (FaST-LMM) programme. For Manhattan plots, −log10 P values from a genome-wide scan are plotted against the position of the SNPs on each of 12 chromosomes, and the horizontal grey dashed line indicates the genome-wide suggestive threshold (P=1.21 × 10⁻⁶). For quantile-quantile plots, the horizontal axis shows −log10-transformed expected P values, and the vertical axis indicates −log10-transformed observed P values. The names of known related genes are shown above the corresponding association peaks.

