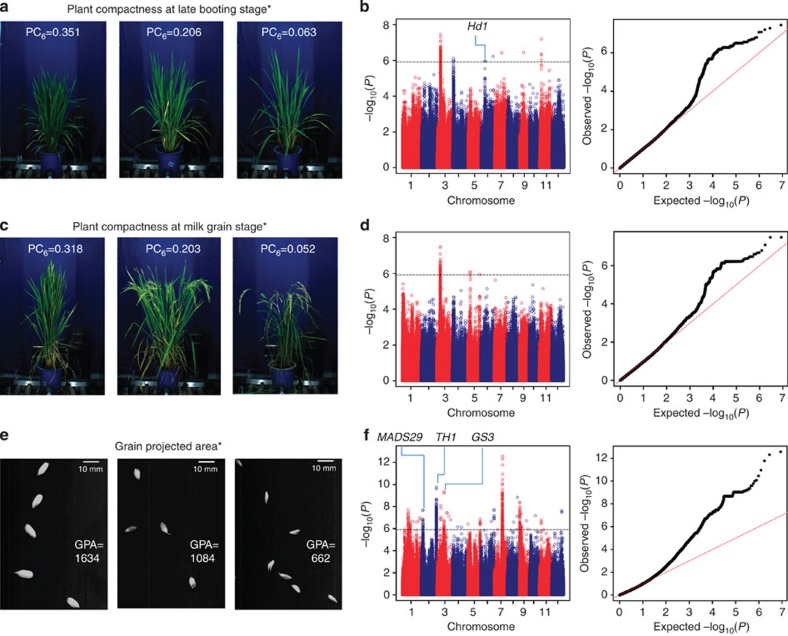
Figure 5. Comparison of rice accessions exhibiting different plant compactness values and grain-projected areas.
Representative rice accessions exhibiting different plant compactness values at late booting stage (a), different plant compactness values at milk grain stage (c), and the grain-projected area (e). Manhattan plots (left) and quantile-quantile plots (right) for plant compactness at late booting stage (sample size=402) (b), plant compactness at milk grain stage (sample size=269) (d), and grain-projected area (sample size=514) (f). The P values are computed from a likelihood ratio test with a mixed-model approach using the factored spectrally transformed linear mixed models (FaST-LMM) programme (P=1.21 × 10⁻⁶). *New traits are those that cannot be defined and extracted using traditional measurement techniques.

