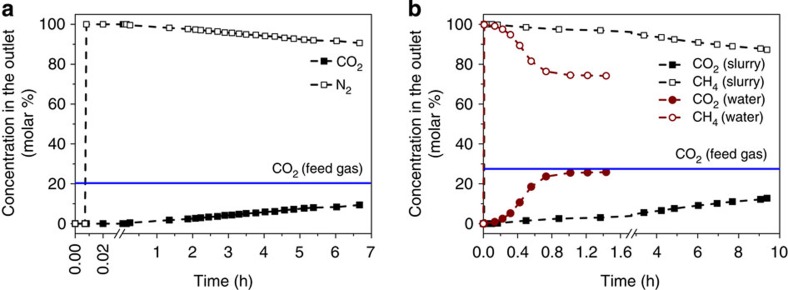
Figure 4. Breakthrough experiment.
(a) Bubble column breakthrough experiment for a CO2/N2 gas mixture (z1=0.2065) (303.15 K, 1 bar) carried out in ZIF-8/glycol–mIm slurry, (b) Column breakthrough experiments for a CO2/CH4 gas mixture (z1=0.276) (303.15 K, 1 bar) carried out in both ZIF-8/glycol–mIm slurry and pure water. The x axis is the time of the breakthrough experiment, the left y axis represents the concentration of gas components in outlet gas.

