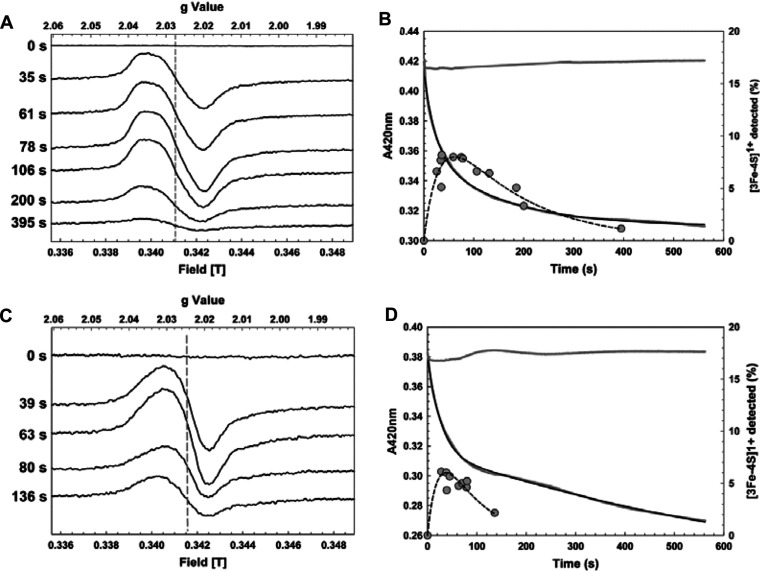
Figure 5. Detection of [3Fe-4S]1+ intermediate formation and decay by EPR and optical spectroscopies.
EPR spectra of reconstituted 23 μM [4Fe-4S] (A) D154A FNR and (C) I151A FNR in buffer A as a function of time after exposure to O2. EPR parameters: temperature, 15 K; microwave power, 2.0 mW; frequency, 9.67 GHz; modulation amplitude, 0.5 mT. Spectra are normalized to the same gain. The broken line indicates the shift in g-value in the intermediate species. (B and D) A420 decay as a function of time following addition of O2 to D154A (B) and I151A (D) FNR, along with time-dependent EPR data (filled circles). Simultaneous exponential fits (see the ‘Data analysis’ section) of the optical and EPR data are shown as continuous and broken lines respectively.

