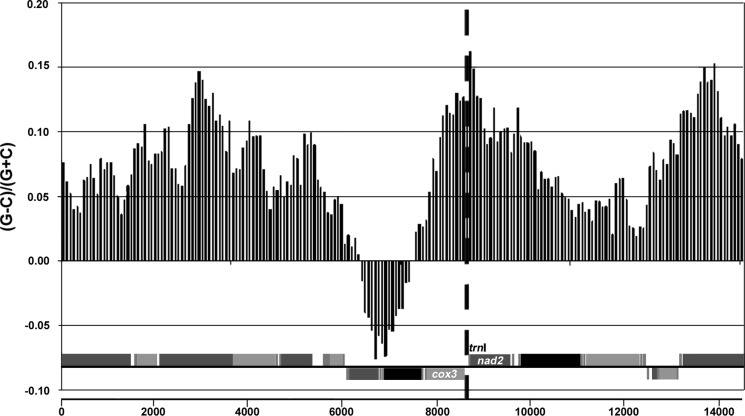
Figure 3.
Potential origin of replication (POR), location by GC skew analysis. GC skew [(G − C)/(G + C)] ratios plotted in a bar graph relative to a linear representation of the mt genome of P. acuta (isolate A shown). Positive values indicate greater G content and negative values indicate increased C content. The vertical dotted line indicates the predicted location of the POR; note the GC skew maximum at 0.162 that further supports this prediction. This high peak is the origin of the sequence interval (window size 2,500 nt) with the highest GC skew, transitioning from low GC skew upstream (Xia, 2012). Shading of protein-encoding and RNA genes as in Figure 2.

