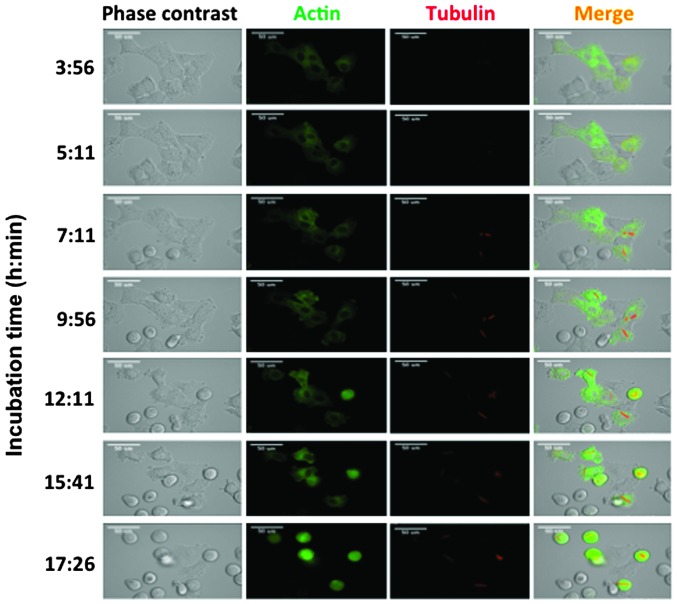
Figure 4.
Time-lapse observations of paracrystal formation in viblastine-treated A549 cells. Cells with fluorescently-labeled tubulin and actin were observed using an LCV110 system. Incubation times are shown on the left of the images. Duration of incubation is presented by the horizontal axis (magnification, ×140).

