Figure 2.
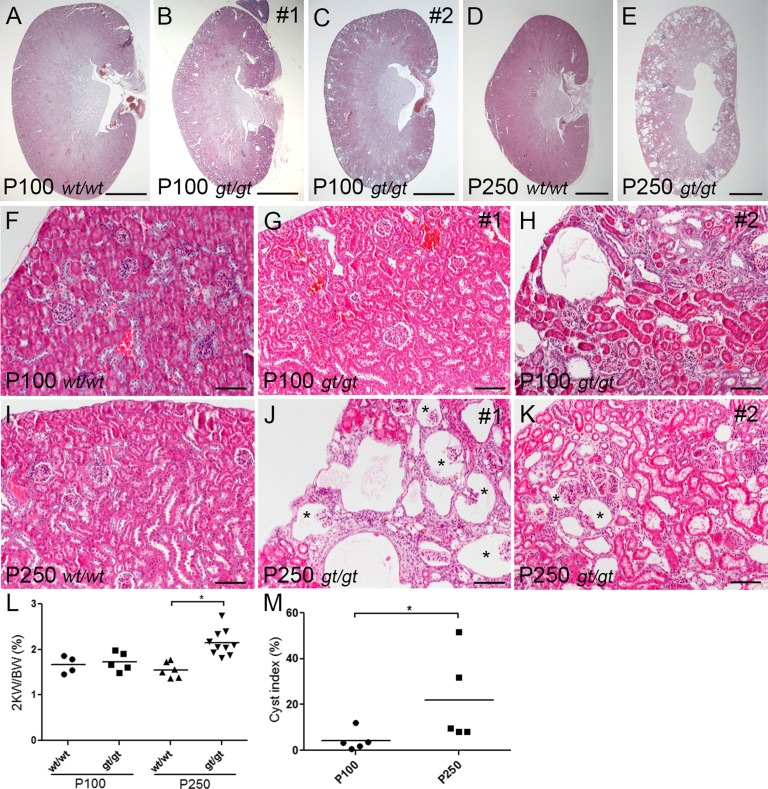
Sdccag8gt/gt mice develop nephronophthisis. (A–C) H&E staining of sagittal sections of P100 kidneys shows the formation of cortical cysts in Sdccag8gt/gt kidneys (B and C). (D and E) Analysis of H&E staining on sagittal sections of P250 kidneys shows loss of corticomedullary differentiation and progressive cyst formation in Sdccag8gt/gt kidneys (E). (F–H) H&E-stained Sdccag8wt/wt (F) and Sdccag8gt/gt (G and H) kidney sections demonstrate the variation in tubular cyst size and amount of interstitial infiltrate in Sdccag8gt/gt kidneys at P100 (G and H). (I–K) By P250, kidney cysts and interstitial infiltrate have replaced most of the renal parenchyma in Sdccag8gt/gt kidneys (J and K). Glomerular cysts are marked with asterisks. (L) The kidney weight to body weight ratio is not changed in Sdccag8gt/gt mice at P100 (mean wt/wt 1.667±0.09516, gt/gt 1.732±0.09247); however, the ratio is significantly increased in P250 Sdccag8gt/gt mice (mean wt/wt 1.554±0.07007, gt/gt 2.151±0.08878; *P<0.05). (M) The kidney cyst index is low in P100 Sdccag8gt/gt mice (mean 4.270±2.024), but is greatly increased and with noticeable variation in P250 mice (mean 21.91±8.662; *P<0.05). H&E, hematoxylin and eosin; wt, Sdccag8 wild-type allele; gt, Sdccag8 gene-trap allele; KW/BW, kidney weight to body weight ratio. Bar, 2 mm in A–E; 100 μm in F–K.

