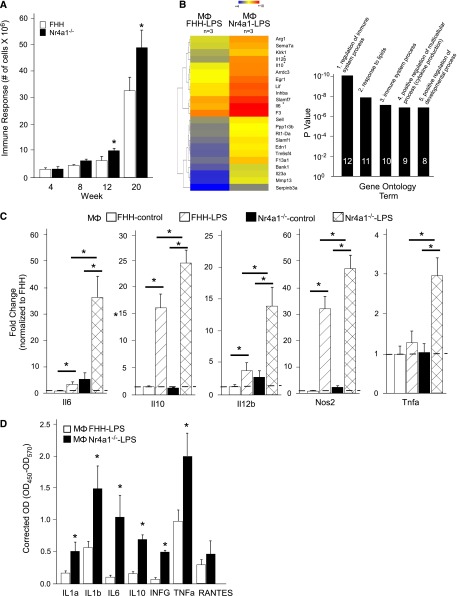
Figure 4.
Thioglycolate-elicited macrophages and primary cell culture from FHH and Nr4a1−/− rats. (A) Quantitation of intraperitoneal cell infiltration at weeks 4, 8, 12, and 20. (B) Hierarchical clustering and gene ontology of differentially expressed genes between LPS-treated cultured macrophages (Mɸ) from FHH and Nr4a1−/− rats at week 20. Mɸ FHH-LPS is set as the control. The heat map colors denoted how genes are downregulated or upregulated within each group and across groups (FHH versus Nr4a1−/−). Genes denoted in blue are downregulated and genes denoted in red are upregulated. (C) Quantitative real-time PCR confirmation of important inflammatory genes identified by microarray on untreated and LPS-treated macrophages from each group. (D) Measurement of secreted inflammatory chemokines/cytokines by ELISA. n=6 for animal macrophage isolation. n=3–4 independent samples for primary culture studies. *P<0.05 versus FHH. RANTES, regulated upon activation, normal T cell expressed and secreted.

