Figure 2.
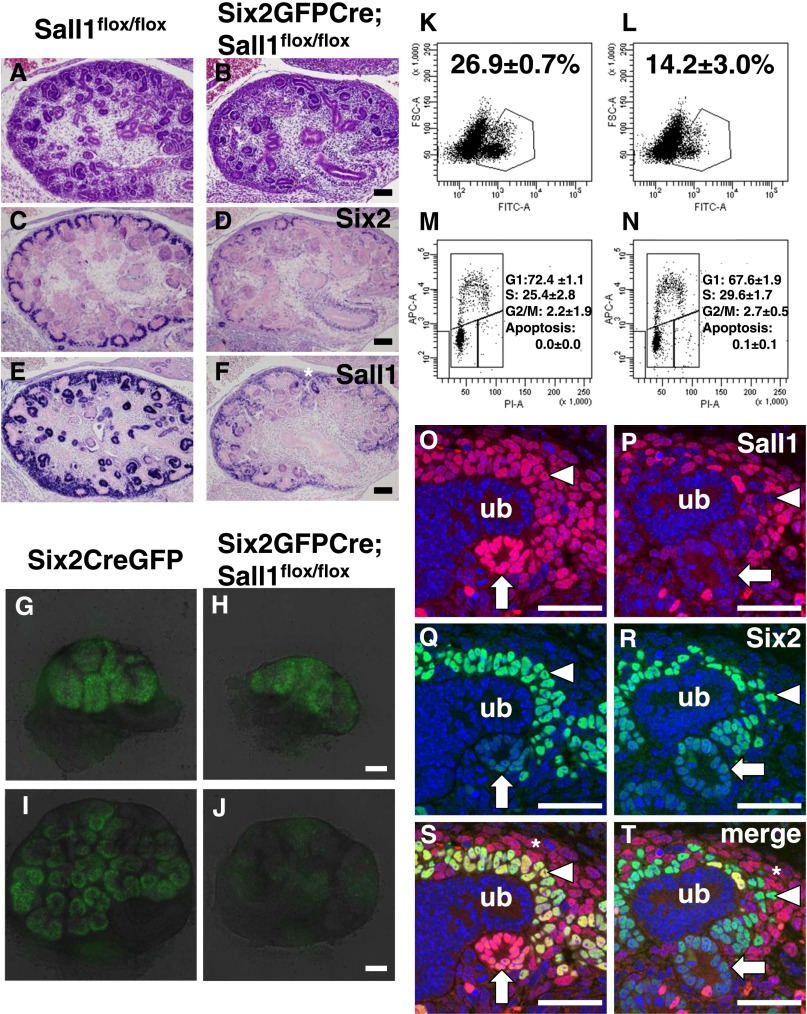
Nephron progenitors are depleted in midgestation embryos. (A and B) Hematoxylin-eosin staining of E14.5 kidneys. Scale bar, 100 μm. (C and D) Immunostaining for Six2. There are fewer Six2-positive cells relative to controls. (E and F) Immunostaining for Sall1. There is much less expression of Sall1 in the mutant nephron components. *Sall1 in the stroma remains expressed. (G–J) Expansion of nephron progenitors in organ culture. (G and H) Kidneys at the beginning of the culture (E12.5). (I and J) Kidneys after 2 days of the culture. The GFP signal in the mutant kidney becomes weaker during the course of the culture. Time-lapse videos are shown in Supplemental Video 1 (Six2GFPCre) and Supplemental Video 2 (Six2GFPCre;Sall1flox/flox). Scale bar, 100 μm. (K and L) FACS analysis of the GFP-positive cells. Kidneys were isolated at E12.5 and cultured for 2 days. The proportion of GFP-positive progenitors is significantly less in the mutant. Average (SD) of three samples. A, area; FSC, forward scatter; PI, propidium iodide. (M and N) Cell cycle analysis of GFP-positive cells. There is no difference between the Sall1 mutant and the control. Average (SD) of three samples. (O–T) Dual immunostaining of Sall1 and Six2 in Sall1flox/flox and Six2GFPCre;Sall1flox/flox kidneys at E13.5. Sall1 expression (red) is reduced in some of the nephron progenitors (arrowheads) and differentiating nephrons (arrows). The expression of Sall1 is not affected in the stroma (*). There are fewer Six2-positive cells (green), but most of them are negative for Sall1. ub, Ureteric bud. Scale bar, 40 μm.

