
Figure 2.
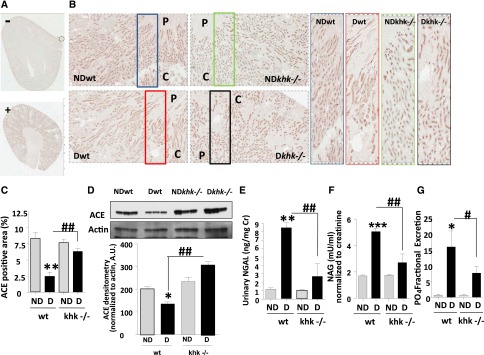
Improved tubular function in diabetic khk−/− mice compared to wild-type siblings. (A and B) Representative kidney sections stained for ACE in nondiabetic and diabetic wild-type mice and khk−/− mice. Tubular area is shown. C, cortex; P, papilla. (A) Negatively and positively staining controls. Original magnification, ×2 in A; ×20 in B. (C) Quantification of ACE-positive area in all groups. (D) Representative Western blot for ACE from kidney cortex homogenates showing significantly lower ACE levels in diabetic wild-type mice compared with nondiabetic mice and diabetic khk−/− mice. (E) Quantification of urinary NGAL—corrected for creatinine levels—in all groups. (F) Quantification of urinary NAG—corrected for creatinine levels—in all groups. (G) Quantification of fractional excretion of phosphate in all groups. (n=6). D, diabetic wild-type; ND, nondiabetic wild-type. Mean±SEM. *P<0.05, **P<0.01, ***P<0.001 versus respective nondiabetic control; #P<0.05, ##P<0.01, and ###P<0.001.