
Figure 5.
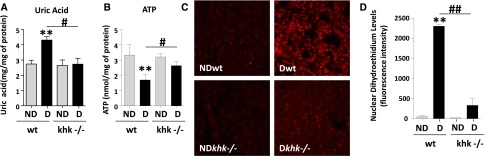
Reduced renal uric acid and oxidative stress in diabetic khk−/− mice compared to wild-type siblings. (A) Quantification of renal cortex uric acid levels in all groups. (B) Quantification of renal cortex ATP levels in all groups. (C) Representative images of DHE staining demonstrating increased nuclear staining in diabetic wild-type mice compared with the rest of the groups. Original magnification, ×20. (D) Fluorescence intensity quantification of DHE in all groups. D, diabetic wild-type; ND, nondiabetic wild-type. Mean±SEM. **P<0.01 versus respective nondiabetic control; #P<0.05 and ##P<0.01.