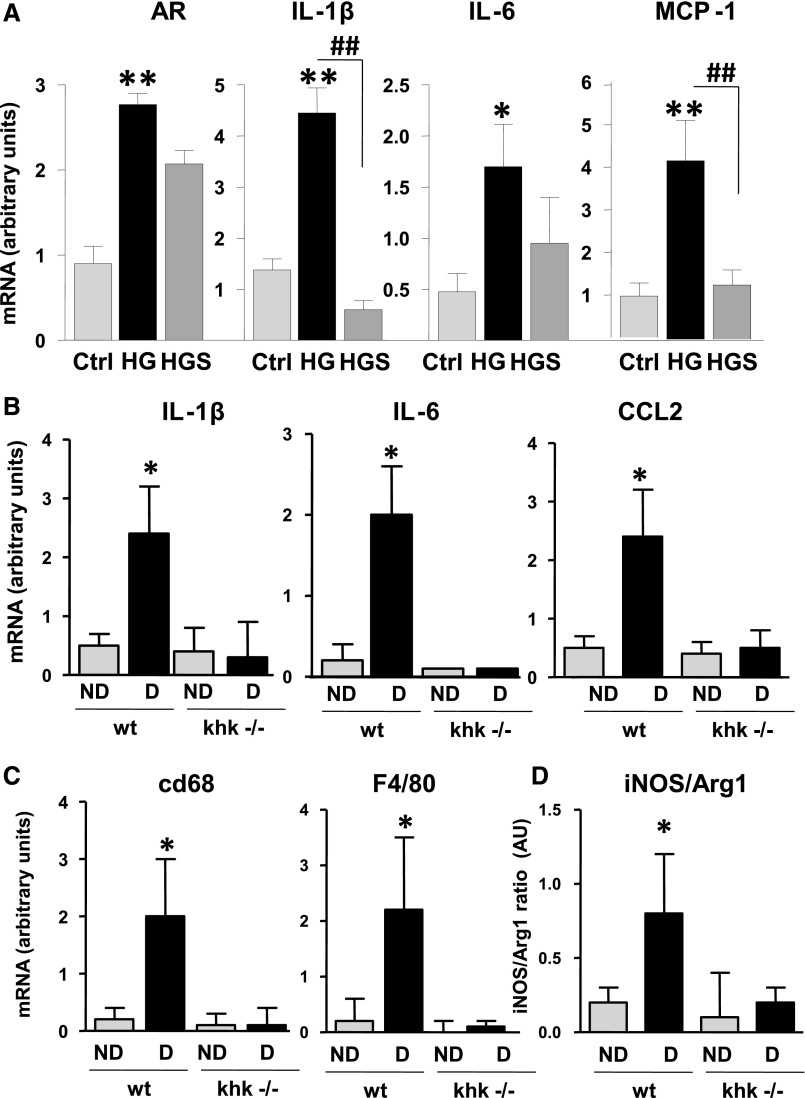
Figure 7.
Reduced inflammatory markers in the proximal tubule after blockade of aldose reducatse and fructokinase. (A) mRNA expression of AR, cytokines (IL-1β and IL-6), and the chemokine MCP-1 in HK-2 cells control (ctrl), and exposed to 25 mM high glucose (HG) alone or in the presence of the AR inhibitor sorbinil (HGS; 10 µM). *P<0.05 and **P<0.01 versus control; ##P<0.01. (B) Quantification of mRNA levels of IL-1β, IL-6, and CCL2 in kidney cortex of diabetic wild-type and khk−/− mice. (C) Quantification of mRNA levels of the macrophage markers CD68 and F4/80 in kidney cortex of diabetic wild-type and khk−/− mice. (D) Quantification of mRNA ratio between inducible nitric oxide synthase (iNOS) and Arg1 in kidney cortex of diabetic wild-type and khk−/− mice. (n=6). D, diabetic wild-type; ND, nondiabetic wild-type. Mean±SEM. *P<0.05 versus diabetic khk−/−.

