Figure 8.
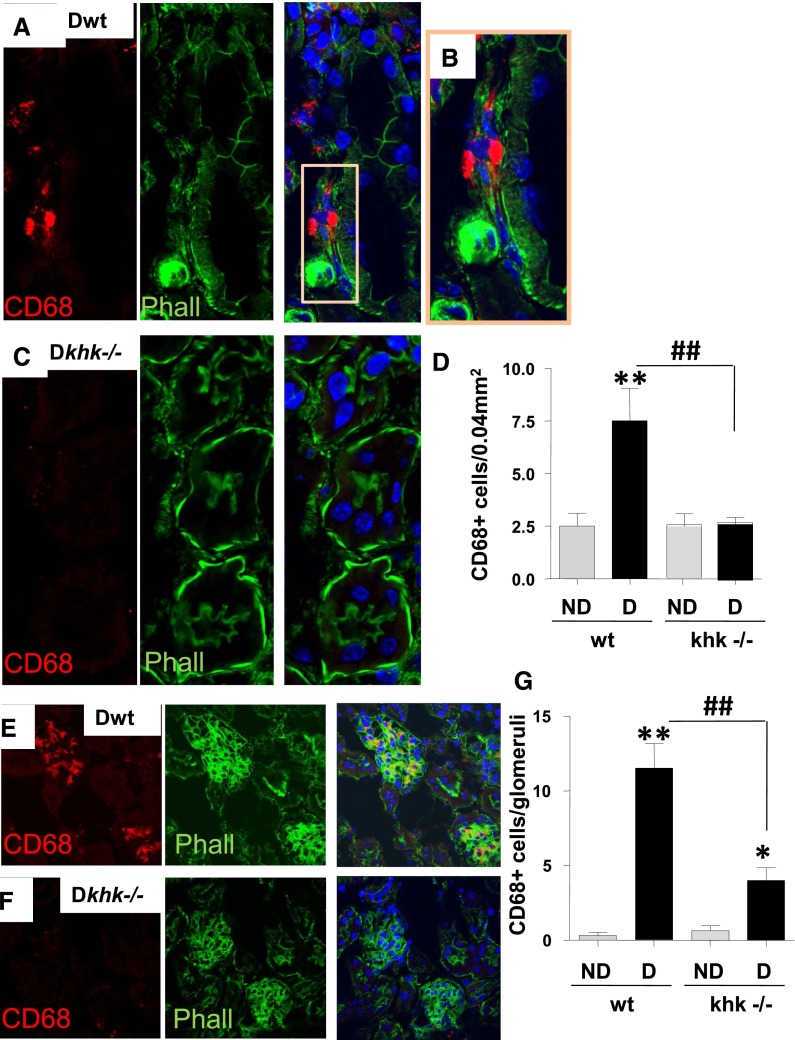
Fructokinase deficiency results in reduced macrophage infiltration in the diabetic kidney. (A) Representative kidney sections stained for CD68 in diabetic wild-type mice. Tubular area is shown. CD68 is represented in red pseudocolor and phalloidin (polymerized actin) is represented in green pseudocolor. Nuclei are counterstained with DAPI (blue). (B) Amplification from part A to better denote macrophage presence underlying the basal membrane of injured tubules (no apical membrane staining with phalloidin). (C) Representative kidney sections stained for CD68 in diabetic khk−/− mice. Tubular area is shown. (D) Quantification of CD68 positive cells per area in the tubular region in all groups. Original magnification, ×63 in A and C; ×40 in E and F. (E) Representative kidney sections stained for CD68 in diabetic wild-type mice. Glomerular area is shown. (F) Representative kidney sections stained for CD68 in diabetic khk−/− mice. Glomerular area is shown. (G) Quantification of CD68 positive cells per area in the glomerular region in all groups. (n=6). D, diabetic wild-type; ND, nondiabetic wild-type. Mean±SEM. *P<0.05 and **P<0.01 versus respective nondiabetic control; ##P<0.01.

