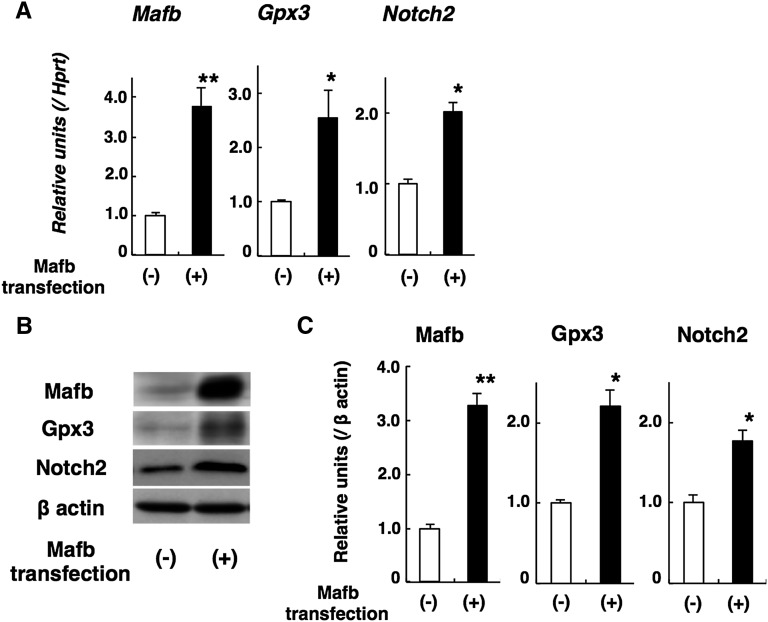
Figure 7.
Mafb upregulates Gpx3 and Notch2 expression in cultured podocytes. (A) Quantitative RT-PCR analysis. Gpx3 and Notch2 elevation was observed in Mafb-transfected podocytes. (B) Representative Western blotting of Mafb, Gpx3, and Notch2. (C) Graph depicting quantitative analysis by Western blot. Gpx3 and Notch2 elevation was found in Mafb-transfected podocytes. Values represent the means±SEMs (n=3 per group in independent experiments). *P<0.05; **P<0.01.

