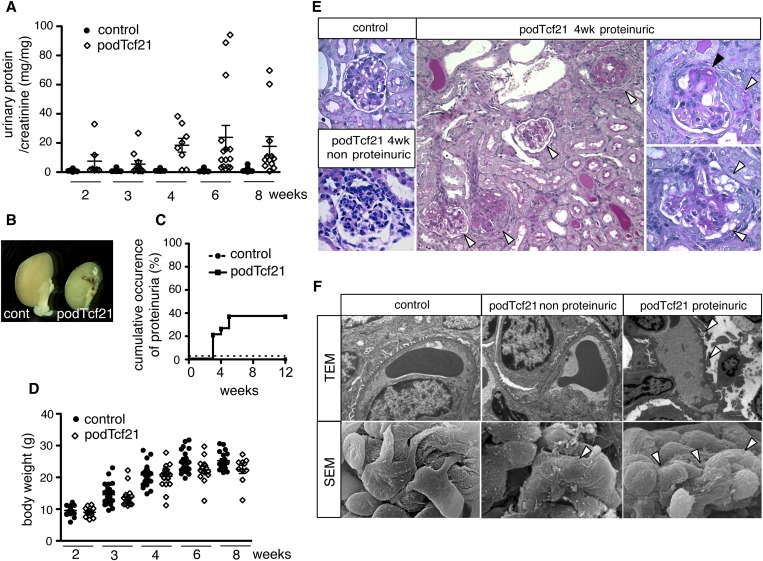
Figure 3.
Forty percent of podTcf21 mice develop proteinuria and FSGS. (A) Urinary protein-to-creatinine ratio in control and podTcf21 mice. Bars indicate mean±SEM. Forty percent of podTcf21 mutants developed massive proteinuria at 3 weeks onward. (B) Macroscopic picture of control and podTcf21 kidneys from mutant with massive proteinuria at 4 weeks of age. (C) Cumulative occurrence of proteinuria that is >3+ by dipstick or 20 mg/mg protein-to-creatinine ratio. Only 40% of the mutants develop proteinuria, identifying both a protected and a susceptible cohort. (D) Body weight of control versus podTcf21 mice. Bars indicate mean±SEM (24.5 g control versus 22.4 g podTcf21 at 6 weeks, 25.2 g control versus 22.5 g podTcf21 at 8 weeks; for both P<0.05). (E) Periodic acid-Schiff–staining of podTcf21 kidneys shows FSGS lesions. Various degrees of glomerulosclerosis and protein casts in tubules (arrowheads, middle panel), partial glomerulosclerosis (black arrowhead) with crescent formation (white arrowhead, right upper panel), and vacuolations in podocytes (white arrowheads, right lower panel) are shown. Middle panel, ×200; others, ×1000. (F) Ultrastructural analysis of podTcf21 glomeruli. In non-proteinuric podTcf21 mice (middle panels), no abnormality was detectable by TEM, but scanning electron micrograph (SEM) shows partial flattening and disorganization of podocyte foot processes (arrowhead). These findings are more prominent and global in proteinuric podTcf21 glomeruli (arrowheads, right panels). TEM, ×9600; scanning electron micrograph, ×12,400.

