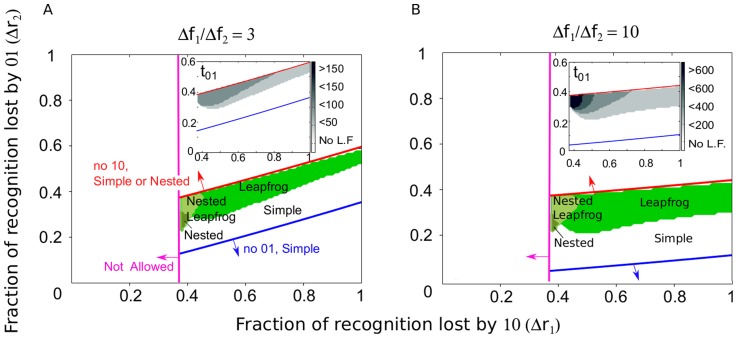
Figure 5. The pattern of emergence of escape variants in a single epitope contains information about the fraction of recognition and fitness lost by single-site mutations in the epitope.
Using simulation of the model (Figure 1A, Equations 6 to 8) with two sites per epitope,  , the pattern of escape is calculated for a range of recognition and fitness losses. The pattern that is obtained is plotted as a function of the parameters of recognition loss at the first and second site (
 and
and  , respectively). In each panel, certain parameters are fixed in order to focus on the effect of recognition loss. Fixed parameters are: the escape rate of the first haplotype (
 ) and the number of targeted epitopes (
 ), values which correspond to escape mutations that occur in acute infection (see Figure S3 for parameters that correspond to later in infection). Fitness costs are chosen such that the second site is less costly than the first:
  equal to 3 (A) or much less costly than the first,
  (B). Other parameters given in Table 1. Mostowy: 2012iv Equations S6 (red line) and S9 (blue line) determine the region where the leapfrog pattern can be observed. Regions that require
  are not allowed by definition (magenta line). The shaded regions between these three lines correspond to regions of parameter space where both sites escape. The corresponding patterns are: “leapfrog” (
 , Figure 4C), “nested” (
 , Figure 4E), “nested leapfrog” (
 ). Observation of the leapfrog pattern in an epitope tightly constrains the fraction of CTL recognition loss conferred by sites in an epitope. The inset shows the length of time during which haplotype 01 is dominant in the escaping epitope.

