
Figure 2. coe RNAi strongly inhibits the expression of ChAT in intact planarians.
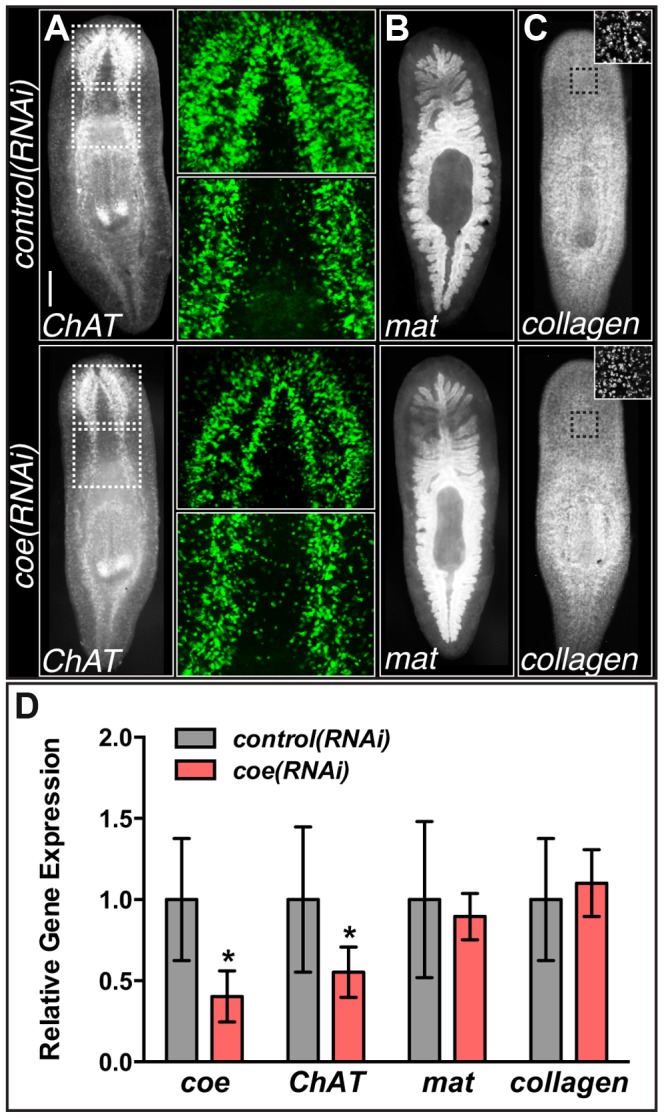
(A–C) coe RNAi-treated animals were processed for fluorescent in situ hybridization (FISH) to ChAT (N = 10 for each treatment), mat (N = 3 control and 4 RNAi planarians), or collagen (N = 7 control and 5 RNAi). White dashed boxes in A denote regions imaged at higher magnification shown in the panels to the right. Black dashed boxes in C denote regions imaged at higher magnification shown in top right insets. (D) RT-qPCR experiments measuring the relative expression of coe, ChAT, mat, or collagen in control(RNAi) or coe(RNAi) planarians following the 6th RNAi treatment. Graph shows the mean ± s.d. expression levels relative to the controls. *P<0.05, Student's t-test.