
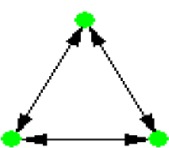
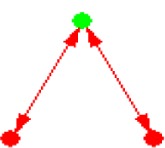
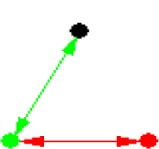
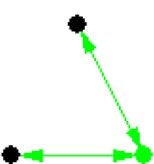
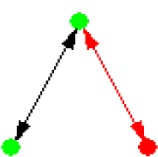
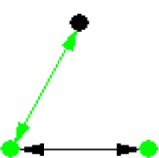
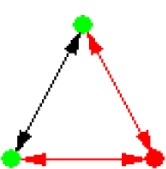
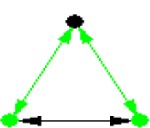
Table 3.
Statistics of significant NMs.
| ID | NETWORK MOTIF | FREQUENCY [ORIGINAL] | MEAN-FREQ [RANDOM] | STANDARD-DEV [RANDOM] | Z-SCORE | P-VALUE |
|---|---|---|---|---|---|---|
| 1 |
|
0.10796% | 0.020394% | 8.3749e-005 | 10.455 | 0.001 |
| 2 |
|
28.502% | 28.444% | 6.5741e-005 | 8.7946 | 0.001 |
| 3 |
|
28.269% | 28.212% | 6.5204e-005 | 8.7946 | 0.001 |
| 4 |
|
10.351% | 10.33% | 2.3875e-005 | 8.7946 | 0.001 |
| 5 |
|
18.279% | 18.264% | 2.0985e-005 | 7.3299 | 0 |
| 6 |
|
8.976% | 8.9643% | 1.6581e-005 | 7.0814 | 0 |
| 7 |
|
0.0644% | 0.053421% | 2.6783e-005 | 4.0995 | 0.011 |
| 8 |
|
0.022872% | 0.019592% | 1.1281e-005 | 2.9072 | 0.013 |
Notes: Node color: green – cancer terms, black – drug, and red – gene. Edge color denotes the associations between different biomedical entities.