Figure 1.

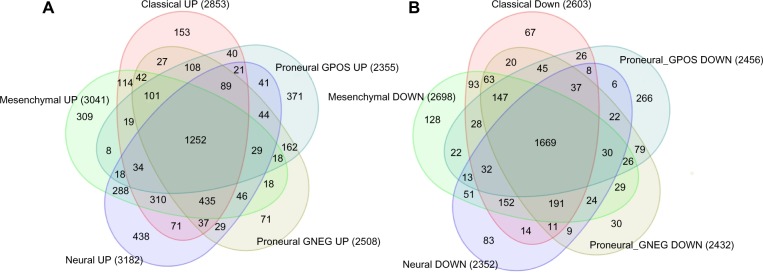
Venn diagram for (A) upregulated and (B) downregulated DEGs for each subtype with respect to normal samples. proneural GPOS: proneural+, proneural GNEG: proneural−.

Venn diagram for (A) upregulated and (B) downregulated DEGs for each subtype with respect to normal samples. proneural GPOS: proneural+, proneural GNEG: proneural−.