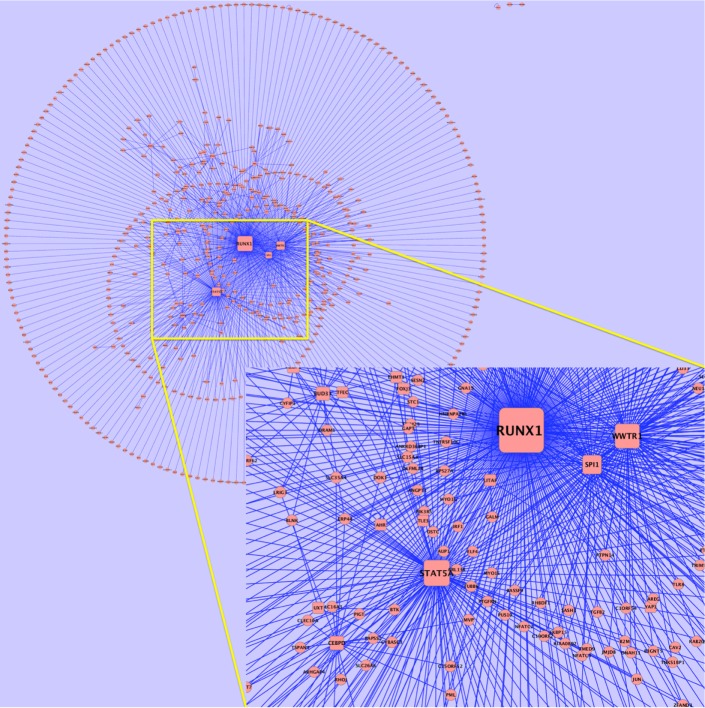
Figure 4.
Gene regulatory network of mesenchymal subtype computed by FastMEDUSA. The network shows the association of upregulated TFs with upregulated gene. Each rectangle node is a TF and each oval node is a gene. The width of the edge is proportional to the TF–gene significance score. The inset figure shows the zoomed view of central area.

