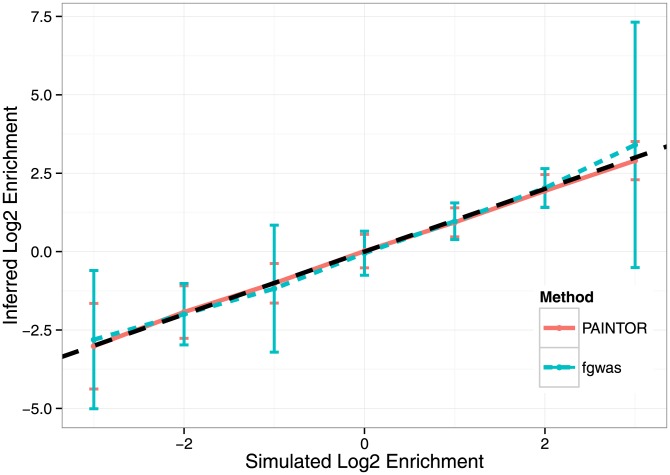
Figure 3. Accuracy of enrichment estimation for a synthetic annotation that contains 8-fold depletion to 8-fold enrichment of causal variants across simulations of fine-mapping data sets over 100 loci.
Using a background and a synthetic functional annotation at a frequency of 1/3 ( ), we simulated with annotation effect sizes such that in expectation, we attained approximately 100 causal variants while maintaining enrichment at a fixed point. We used the standard simulation parameters, fixing the variance explained by these 100 loci to 0.25 and using
  genotypes. We discarded simulations where fgwas failed to converge (see Methods). Displayed here are the mean inferred Log2 enrichment estimates (
 1 SD) that were conducted over 500 independent simulations at each enrichment level.

