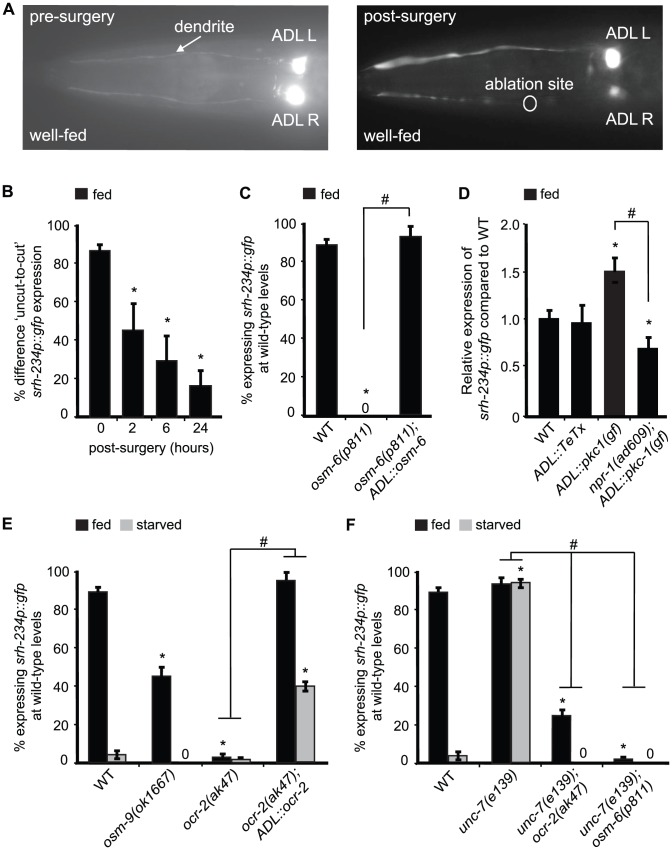
Figure 5. Expression levels of srh-234 are modulated by sensory inputs into ADL, neural outputs from ADL and OCR-2 activity.
A) Pictures show examples of fed animals expressing srh-234p::gfp before (left panel) and after surgery (right panel; 24 hr) of the right ADL (ADLR) dendrite using a femtosecond laser (see Material and Methods). The ablation site is indicated as a circle. B) Difference in fed animals expressing srh-234p::gfp between severed and non-severed (‘cut-to-uncut’) ADL sensory dendrites. Animals (n = 8–17) were examined at 400× magnification for each genotype. C) Percentage of mutant animals with defects in cilia formation expressing srh-234p::gfp at wild-type levels. For strains carrying the ADL::osm-6 extrachromosomal array (see Material and Methods), data shown is the average of two independent transgenic lines. Animals (n>150) were examined at 150× magnification. D) Relative expression of srh-234p::gfp in the indicated genotypes compared to wild-type animals. For strains carrying ADL::pkc-1(gf) or ADL::TeTx extrachromosomal arrays, data shown is for two independent transgenic lines. Animals (n = 10–17) were examined at 400× magnification for each genotype. E, F) Percentage of animals of the indicated genotypes expressing srh-234p::gfp at wild-type levels. For strains carrying the ADL::ocr-2 extrachromosomal array (see Material and Methods), data shown is the average of two independent transgenic lines. Animals (n>150) were examined at 150× magnification. * indicates values that are different from that of wild-type animals at P<0.001, and # between the genotypes compared by brackets at P<0.001 using either a two-sample t-test, or the using a χ2 test of independence. Error bars denote the SEP or SEM.

