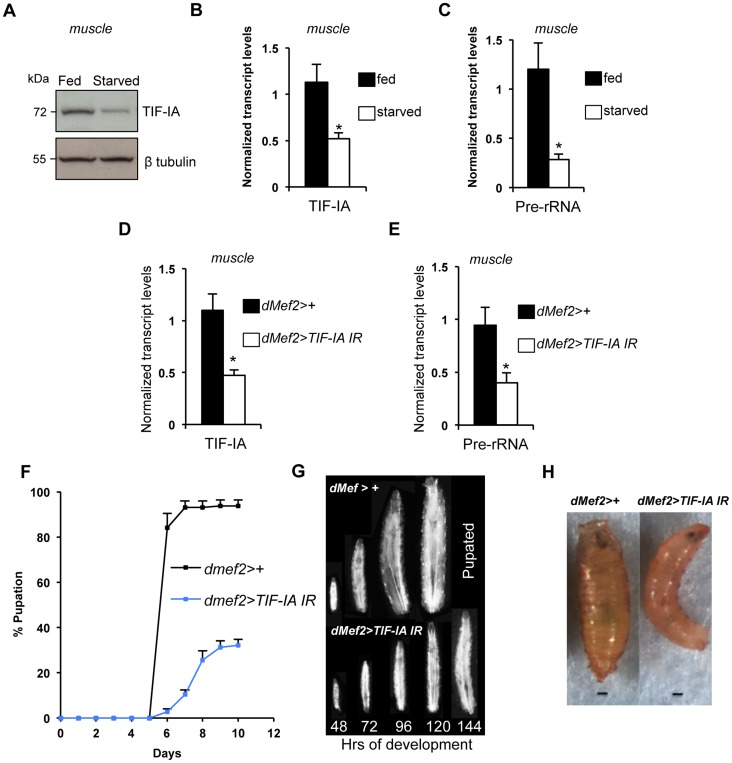
Figure 2. TIF-IA function is required in muscle to maintain overall body growth and development.
(A) Immunoblot indicates TIF-IA protein levels were reduced in 24 hr starved muscle compared to fed muscle, at 72 hr AEL. β tubulin levels indicate loading control. (B) qPCR indicates TIF-IA mRNA levels were reduced in 24 hr starved muscle compared to fed muscle, at 72 hr AEL. Data normalized to β tubulin. (* P = 0.009, Student's t-test). (C) qPCR indicates pre-rRNA levels were reduced in 24 hr starved muscle compared to fed muscle, at 72 hr AEL. Data normalized to β tubulin. (* P = 0.0059, Student's t-test). (D) qPCR indicates TIF-IA mRNA levels were reduced in dMef2>TIF-IA-IR muscle compared to control larval muscle (dMef2>+), at 72 hr AEL. Data normalized to β tubulin. (* P = 0.0022, Student's t-test). (E) qPCR indicates pre-rRNA levels were reduced in dMef2>TIF-IA-IR muscle compared to dMef2>+ (control) larval muscle, at 72 hr AEL. Data normalized to β tubulin. (* P = 0.015, Student's t-test). (F) Developmental timing from larval hatching to pupation of dMef2>+ and dMef2>TIF-IA IR animals, n = 134, n - number of larvae assessed per genotype, (mean time to pupation: dMef2>+, 6.1 days and dMef2>TIF-IA, 7.8 days, * P<0.05, Mann-Whitney U test). (G) Representative images of dMef2>+ (top) and dMef2>TIF-IA IR (bottom) larvae. Numbers at the bottom of the panel indicates hours AEL. (H) Representative images of dMef2>+ and dMef2>TIF-IA IR pupae, scale bar-200 µm. All error bars indicate SEM.

