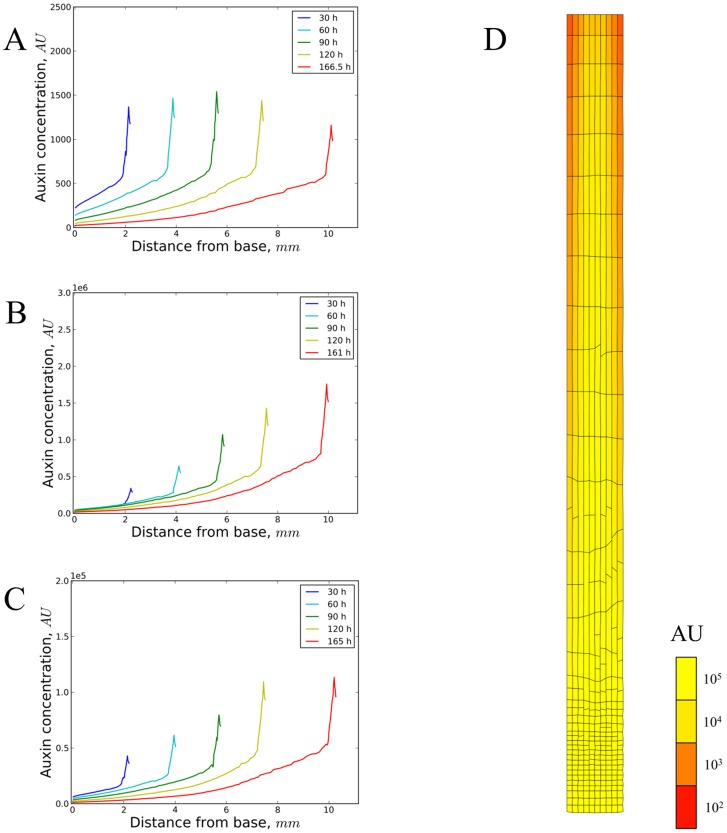
Figure 6. Auxin dynamics on a dynamic cellular grid.
Output of model simulations (Table S1 – Model 9) with cells growing exponentially (in accordance with [32]) at the same low specific growth rate (except the ‘cap’ cells) up to a fixed distance of 240 µm from the tip and then undergoing 10-fold growth acceleration (up to a specific distance of 750 µm). Cell division was based on a sizer mechanism with noise added to have a more irregular, natural, tissue shape (up to a fixed distance of 240 µm from the tip). To not bias the analysis, growth and division did not depend on auxin. Four simulations based on differences in kinetic parameter values as well as some subtle differences in the differential equations were set up to represent different types of auxin sources in the model (see also Text S1, Figure S5). (A–C) Auxin profiles over time in the growing root. (A) A strictly external source of auxin (import from upper vascular and border cell walls, export via epidermal cell walls). Kinetic parameters (cf.
Text S1):  = 1 µm;
  = 6000 µm2.min−1;
  = 1200 µm.min−1
 = 600 µm.min−1;
  = 0.0003 min−1;
  = 0 (µm2 min)−1;
  = 2.107 min−1. The sharp peak at the apex shifts and slowly dilutes out by steady growth. (B) A strictly internal auxin source (production rates proportional to cell areas). Kinetic parameters that are different from (A):
  = 100 (µm2 min)−1;
  = 0 min−1. The shape of the curve is as in (A) without peak dilution. (C) A strictly internal auxin source (production rates constant on a per cell basis). Kinetic parameters that are different from (A):
  = 104 min−1;
  = 0 min−1. A similarly shaped curve is shown as (A) and (B), but with peak convergence as time progresses. (D) Steady auxin concentration pattern (yellow colouring according to arbitrary concentration units ‘AU’) on a dynamic cellular grid (simulation time 30 h, growth according to the rules in Table S1 – Model 9), with both external and local (area-dependent) auxin sources (and sinks). Kinetic parameters:
  = 100 (µm2 min)−1;
  = 2.107 min−1. Figures S6, S7, S8, S9 illustrate the dependence of the shape of the auxin gradient on the parameters used here (in a non-growing root). More information on the kinetic equations can be found in Text S1.

