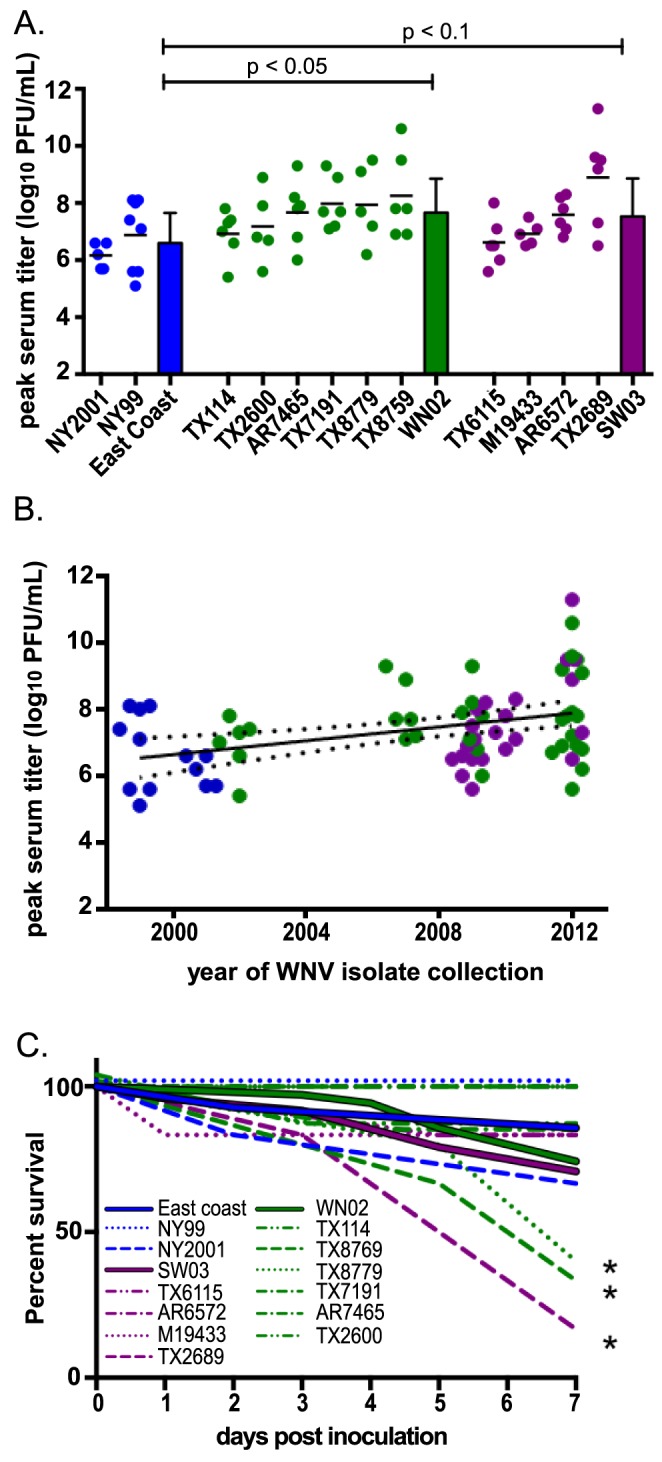
Figure 2. Peak viremias and mortality in HOSPs by viral isolate and over time.

Points represent individual birds. HOSPs inoculated with East Coast viruses are designated in blue; HOSPs inoculated with WN02 viruses are designated in green; and HOSPs inoculated with SW03 viruses are designated in purple. (A) Peak serum titers for individual HOSPs inoculated with one of the 12 WNV isolates. Bars represent the mean peak titer for each WNV genotype. Error bars reflect the standard deviation of the mean. (B) Linear regression analysis of peak serum titer for individual birds inoculated with WNV, stratified by year of virus collection. 95% confidence intervals are shown by the dotted lines. (C) Percent HOSP survival for 7 days post-inoculation. Viral isolates are represented by dashed lines, and genotype means are represented by solid lines. *p<0.05.
