
Figure 4. Carbachol-induced phosphorylation of proteins in the RLC signalling module shows modest differences between tissues from MYPT1SM−/− and MYPT1SM+/+ mice.
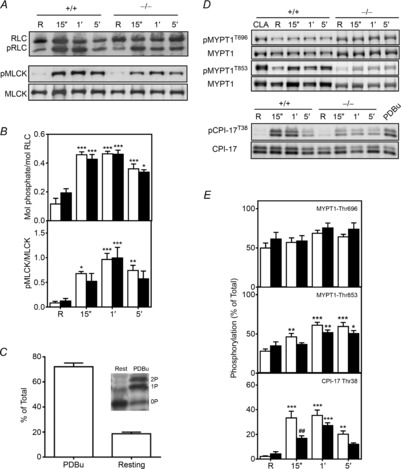
Representative immunoblots (A and D) and quantitative phosphorylation results (B and E) are shown for RLC, CPI-17, MYPT1 and MLCK for bladder tissues from MYPT1SM+/+ (open bars) and MYPT1SM−/− (filled bars) mice. Resting (R) smooth muscle strips were treated with 10 μm CCh and then rapidly frozen at 15 s, 1 min and 5 min. The frozen tissues were processed for protein phosphorylation analysis by immunoblotting as described under Methods. For more accurately measuring MYPT1 phosphorylation in MYPT1SM−/− tissues, the protein loaded was 5-fold greater (10 μg) than the amount loaded from MYPT1SM+/+ samples. CPI-17, and MYPT1 were quantified relative to results obtained with phorbol 12,13-dibutyrate (PDBu) or calyculin A (CLA) as described under Methods. C, Phos-tag PAGE was used to quantify CPI-17 phosphorylation in PDBu-treated tissues (n = 4) which separates CPI-17 according to the extent of phosphorylation) with no (0P), mono- (1P) or diphosphorylated (2P) species. Data are presented as means ± SEM for 6 to10 animals in each group. *P < 0.05, **P < 0.01, ***P < 0.001 vs.. resting value; ##P < 0.01 compared with MYPT1SM+/+ at 15 s as indicated by two-way ANOVA with Tukey's post hoc test for multiple comparisons.