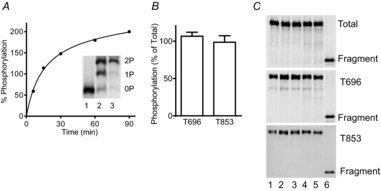
Figure 5. Quantitation of MYPT1 phosphorylation in calyculin A treated bladder strips.

A, purified GST-MYPT1 (654–880) was maximally phosphorylated by ROCK1 in an in vitro kinase assay. Representative time course of phosphorylation is shown with immunoblot for total MYPT1 in the inset. Mono- (P) and diphosphorylated (PP) GST-MYPT1 (654–880) were separated from the non-phosphorylated (N) protein by Phos-tag gel in samples taken before (1), during (2), and end (3) of kinase assay. Samples which were confirmed to be fully diphosphorylated by Phostag gel analysis were used as controls for quantitation of endogenous MYPT1 Thr696 and Thr853 phosphorylation. B, amount of tissue MYPT1 phosphorylated at Thr696 per total Thr696 and tissue MYPT1 phosphorylated at 853 per total 853 are shown as ratios. C, representative blots for calyculin A-treated bladder strips from different wild-type mice (lanes 1–5) and diphosphorylated GST-MYPT1 fragment (lane 6) are shown for total proteins (top panel), phosphorylated Thr696 (middle panel), and phosphorylated Thr853 (bottom panel).
