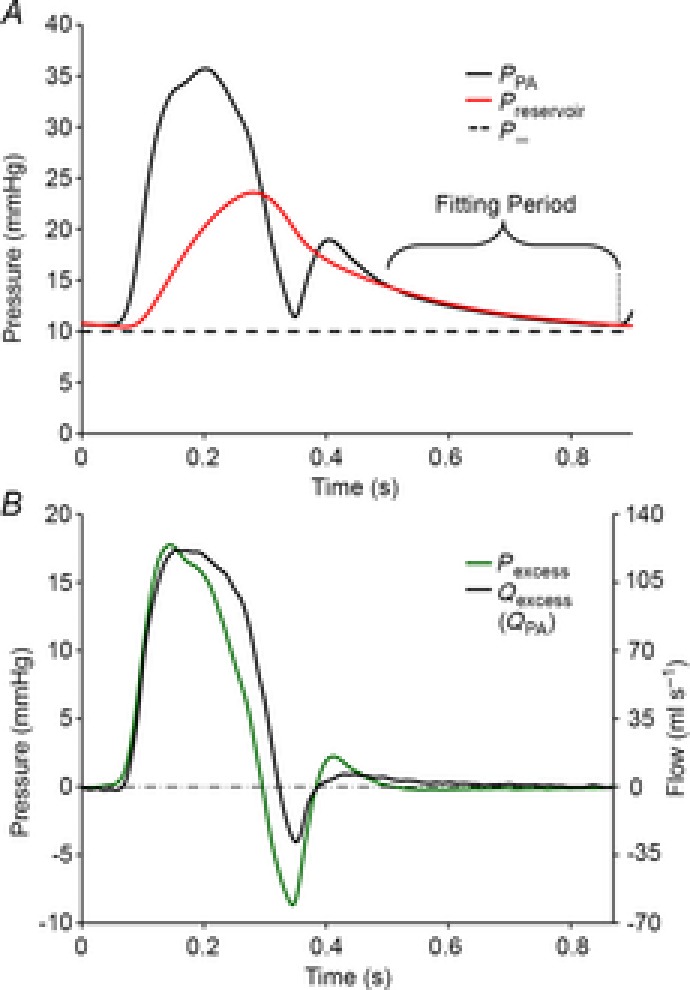
Figure 1. Illustrating how pulmonary artery pressure and flow were analysed and showing pulmonary artery reservoir and excess pressure.

Data are taken during low blood volume, 0 cmH2O positive end-expiratory pressure and 100% O2 ventilation. A, measured pulmonary artery pressure (PPA), pulmonary artery reservoir pressure (Pres) and pulmonary artery asymptotic pressure (P∞). B, excess pulmonary artery pressure (Pexcess) is shown on the left y-axis and excess pulmonary artery flow (Qexcess), which in the main pulmonary artery is equivalent to measured pulmonary artery flow (QPA), is shown on the right y-axis.
