
Figure 4. Pulmonary artery reservoir-wave versus conventional wave analysis.
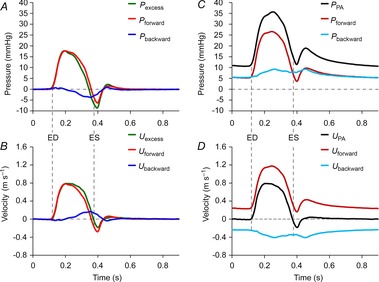
Data are taken during low blood volume, 0 cmH2O positive end-expiratory pressure and 100% O2 ventilation. This figure indicates the importance of subtracting reservoir pressure and velocity from the measured values before analysing wave patterns. A–D, both the pressure and velocity are decomposed into the contributions of forward-going (Pforward and Uforward) and backward-going waves (Pbackward and Ubackward). A, excess pressure (Pexcess). B, excess velocity (Uexcess). C, pulmonary venous pressure (PPA). D, pulmonary venous velocity (UPA). Vertical dashed lines indicate ED and ES, which were defined by the upstroke and down stroke of Uexcess or UPA crossing zero. ED, end diastole; ES, end systole.