
Figure 6. Relationships between cerebral perfusion and blood CO2 and temperature.
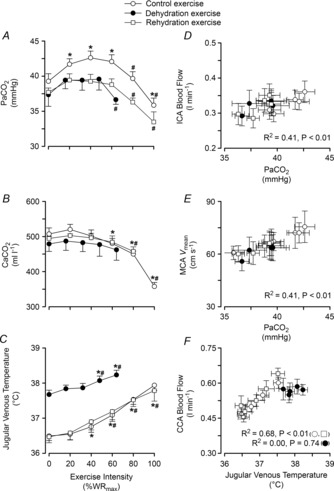
Left panel:  (A), arterial CO2 content (
 , B), and jugular venous temperature responses to incremental exercise (C). Right panel: ICA blood flow and MCA Vmean group mean correlations with
  (D and E), and CCA blood flow group mean correlation to jugular venous temperature (F) in control (open circles), dehydration (filled circles) and rehydration (open squares). *P < 0.05 vs. rest, #P < 0.05 vs. sub-maximal exercise (i.e. ∼40% WRmax). Unless presented, significance for control and rehydration were similar (i.e. panels B and C).