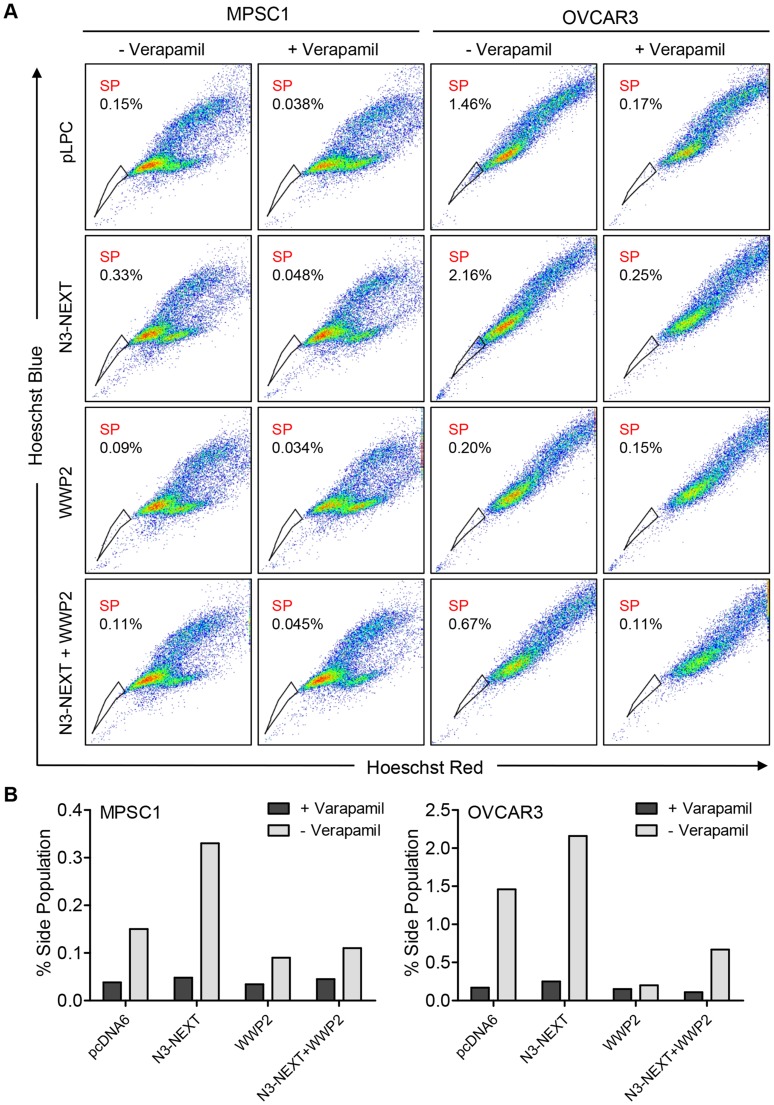
Figure 8. WWP2 counteracts Notch3-induced increase in CSC population.
(A) N3-NEXT overexpression (second row) increased frequencies of verapamil-sensitive SP cell in MPSC1 and OVCAR3 cells compared with pLPC vector-transfected control (first row). Ectopic expression of WWP2 reduced SP fraction in both cell lines (third row). Co-expression of WWP2 in N3-NEXT-expressing cells reduced SP fraction (fourth row) as compared to cells with only N3-NEXT overexpression (second row). (B) Bar charts represent % of SP in each experimental condition.

