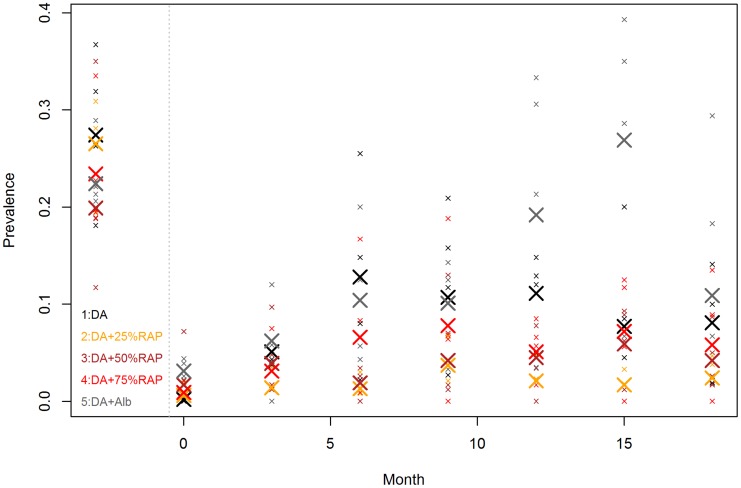
Figure 2. Trypanosome prevalence by time in different regimens.
Small symbols represent the prevalence in the investigated villages. The large symbols represent the mean value of the 4 prevalence estimates in each regime. Animals infected with either T.vivax. T.b.brucei, T.b. rhodesiense, T.c.savannah are considered infected. The data left to the dotted vertical line denote the baseline estimates determined about 9 months before treatment.

