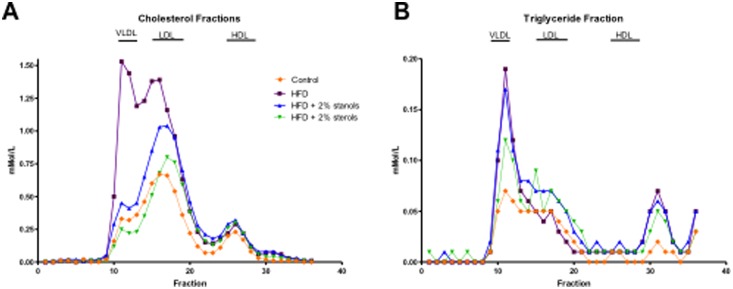
Figure 5. Serum lipid and lipoprotein profiles.

(A, B) Using FPLC, serum lipid and lipoprotein profiles were analyzed in all experimental groups. On the chromatogram, the X-axis represents the fractions present in the mixture as a peak, thereby identifying the different components of the mixture. On the Y-axis, the amount of the different fractions can then be read (nMol/l).
