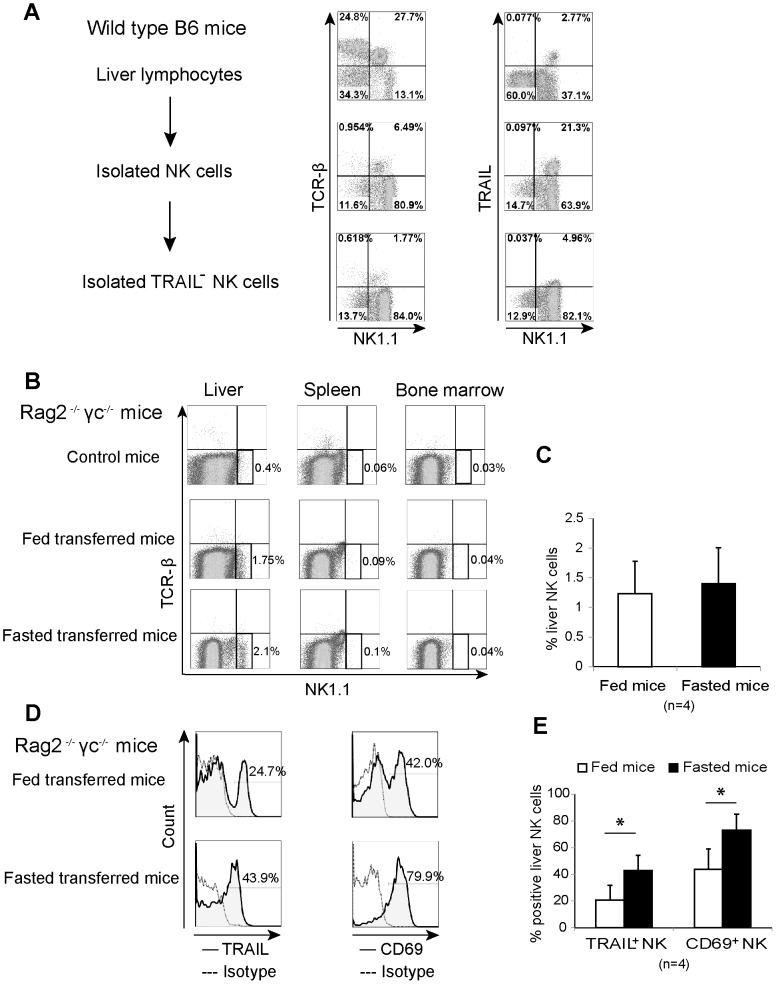
Figure 4. Adoptive transfer assay for TRAIL and CD69 expression on liver natural killer cells in response to starvation.
(A) Isolated TRAIL− natural killer (NK) cells were separated from liver lymphocytes of wild type B6 mice. Proportion of lymphocytes expressing TCRβ, NK1.1, and TRAIL in whole liver lymphocytes, isolated NK cells, and isolated TRAIL− NK cells are presented in dot plots. The isolated TRAIL− NK cells were adoptively transferred into Rag-2−/− γ chain−/− mice (0.5×10⁶ cells/mouse), which were then fed or fasted for 3 days before determining their NK phenotype. (B) Dot plots show the gated TCRβ− NK1.1+ NK cells and their percentage in the liver, spleen, and bone marrow of non-transferred (control), fed-transferred, and fasted-transferred mice. (C) Bar graph presents the mean percentage plus standard deviation of NK cells in the liver of fed and fasted-transferred mice. (D) Expression of TRAIL and CD69 (solid lines) on the liver NK cells of representative fed- and fasted-transferred mice with their percentages of positive cells are presented in histograms; dotted lines showed the negative control. (E) The proportion of liver TRAIL+ and CD69+ NK cells in fed and fasted-transferred mice are shown in bar graph as mean plus standard deviation; *p <0.05 as analyzed by the independent samples T test.

