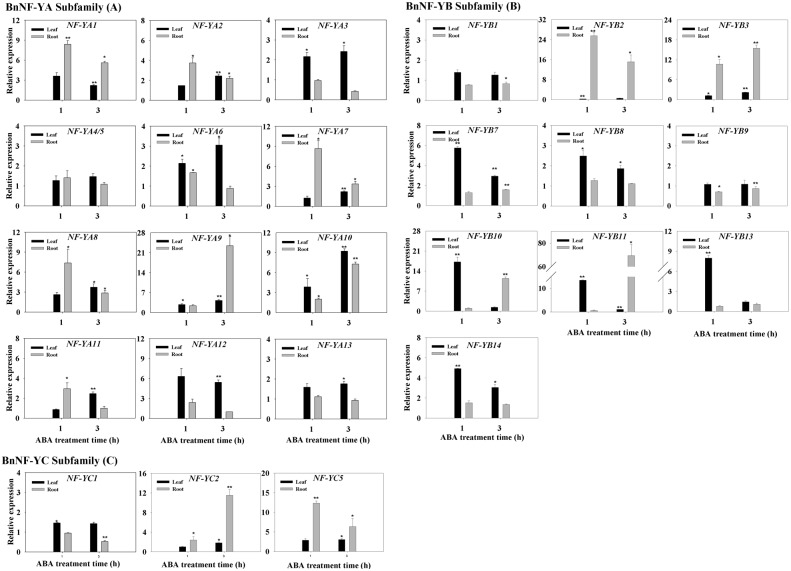
Figure 3. Expression pattern of the BnNF-Y genes in the leaves and roots of plants exposed to 100 µM ABA.
Transcript levels of BnNF-Y (A), BnNF-YB (B), and BnNF-YC (C) genes after exposure to 100µM ABA. Three-week-old canola plantlets were treated with 100µM ABA for 1h and 3h. Total RNA was extracted from leaves and roots for quantitative PCR (qRT-PCR) analysis. Transcript levels of each BnNF-Y were first normalized to those of the housekeeping gene 18S and then compared to levels at each time point in the control. Each data point represents the mean ±SE of three independent experiments. Significant differences between treated samples and untreated controls (same tissue only) are indicated by a single (P<0.05) or double (P<0.01) asterisk, according to Dunnett’s method of one-way ANOVA in SPSS. Expression levels in untreated samples (CK, 1-h or 3-h leaf and root samples) were arbitrarily set to 1.0.

