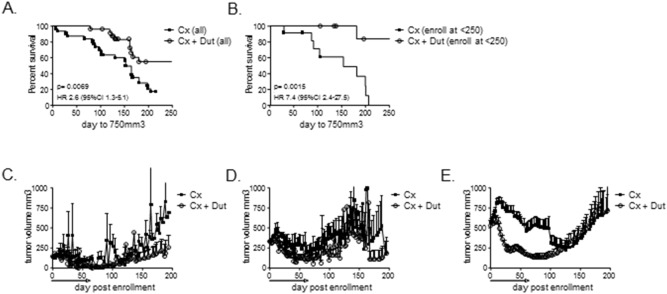
Figure 3. Response to dutasteride by tumor size at enrollment in LuCaP35 xenografts.

Kaplan-Meier plots of progression free survival (defined as tumor size <750 mm3) in all LuCaP35 tumors treated with castration alone (Cx) vs. castration + dutasteride (Cx + Dut) (A), and in tumors enrolled into treatment when tumors were <250 mm3 (B). P-values for curve comparisons were generated using the Mantel-Haenszel logrank test. Mean tumor volume growth curves at the indicated days post enrollment in LuCaP35 tumors enrolled into treatment when tumors were <250 mm3 (C), between 250–400 mm3 (D), and >400 mm3 (E). Dutasteride treatment was continued for 8 weeks (denoted by black line above x-axis) in the castration + dutasteride group.
