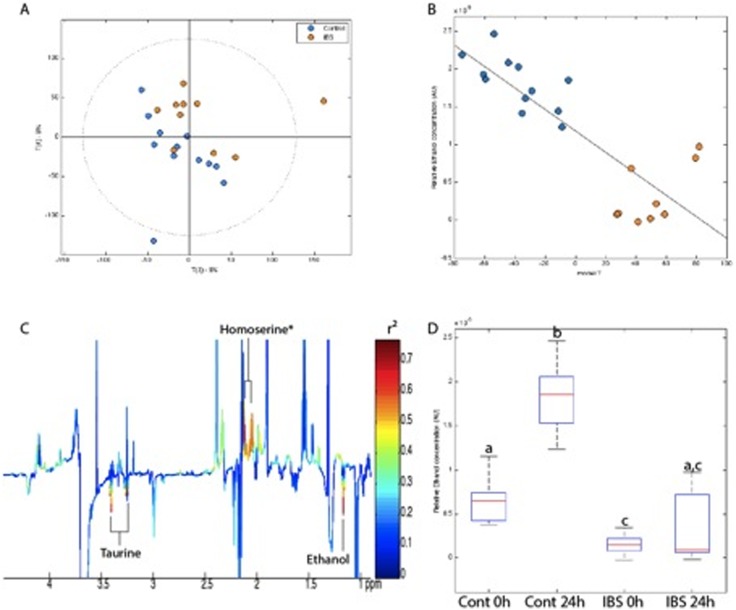
Figure 2. Divergent fermentation of bread samples by IBS and control microbiota.
PCA scores plot (A) and O-PLS-DA scores (B) and associated loadings (C) derived from 700 MHz 1H NMR spectra of fermentation supernatants. Relative ethanol production derived from the integrated area under the curve of original NMR spectra for the methyl protons at 1.18 ppm. ANOVA: p<2.10−16; Multiple comparison test: (a) p<0.0001 different from b and c, (b) p<0.0001 different from a and c. Key: Blue: control; Orange: IBS. *putative assignement.

