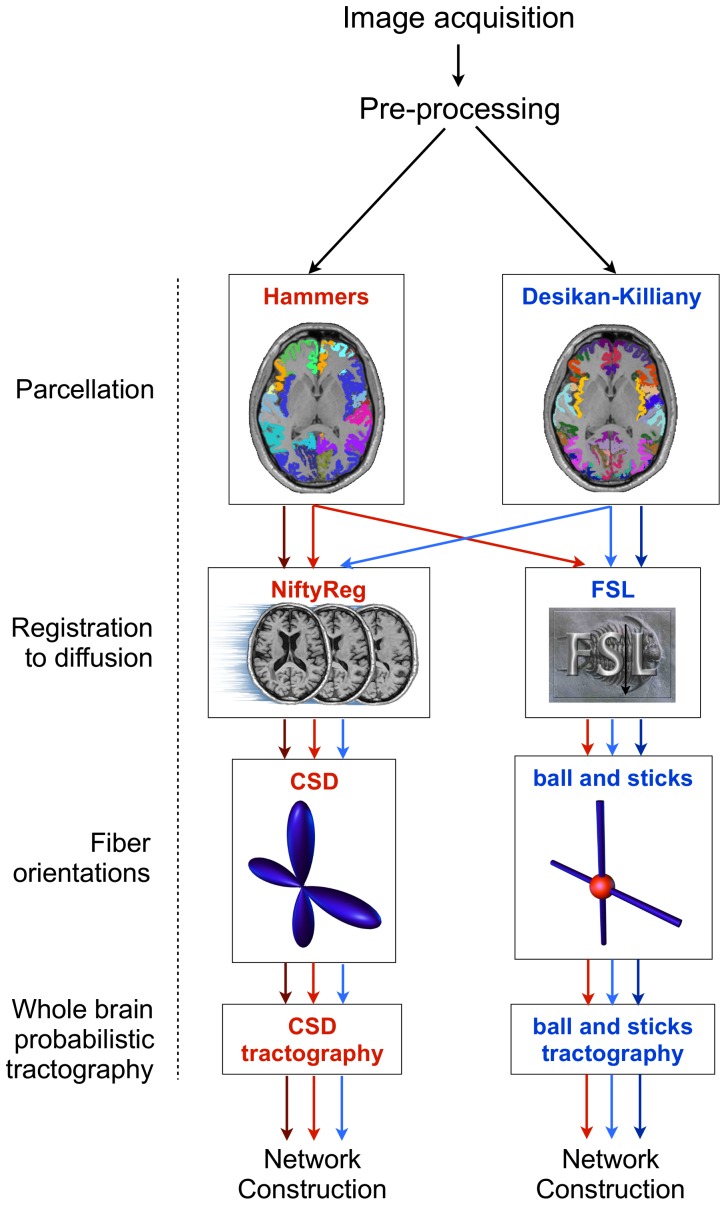
Figure 1. Summary of network reconstruction stages applied to structural and diffusion images for P1 and P2.
The pipeline stages are shown on the left and the alternative implementations of the methods are shown inside the boxes. Arrows indicate the passage of merged (dark arrows) and native (light arrows) atlases through the pipeline stages (red and blue refer to Hammers and Desikan-Killiany atlases, respectively). Nodes were defined by registration of the cortical parcels to diffusion space. Edges were defined by performing tractography from the parcel boundary through the fiber orientations. Note that the whole-brain probabilistic tractography methods differed only in relation to the recommended settings for the software used to track through the fiber orientations. The network construction stage calculated the connecting fiber density between all cortical parcel pairs across the entire cerebral cortex and was identical for both pipelines. Applying these stagesto the merged and native atlases resulted in comparisons between pipelines at three node scales; the merged atlas scale (34 nodes, dark arrows), Hammers atlas scale (44 nodes, light red arrows) and Desikan-Killiany scale (68 nodes, light blue arrows). We also applied the registration and whole-brain tractography pipelines to the AAL atlas (not shown).

