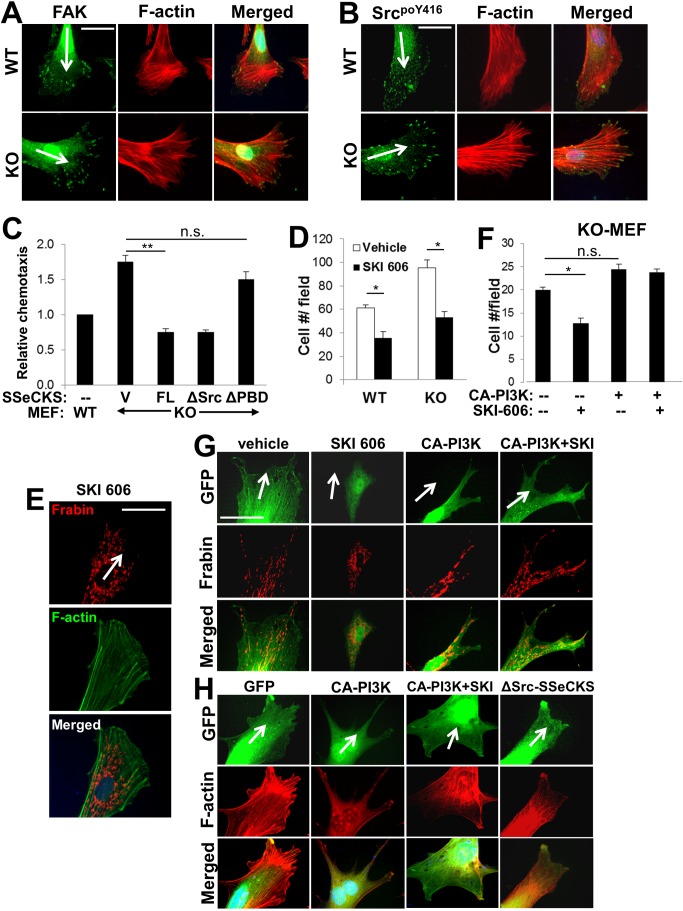
Figure 8. Enrichment of activated Src at the tips of leading edge filopodia in chemotactic KO MEF.
IFA analysis of FAK and F-actin (A), or SrcpoY416 and F-actin (B) in chemotactic WT and KO MEF. Total levels of FAK or SrcpoY416 in the WT vs. KO MEF did not differ [28]. Scale bar, 10 µm. Arrow, chemotaxis direction. C, Relative chemotaxis of WT MEF or KO MEF transfected with vector (V), FL-, ΔPBD- or ΔSrc-SSeCKS-GFP. Error bars, S.E. of 5 visual microscope fields with at least 10 cells/field in two independent experiments. **, p<0.005; n.s., not significant. D, Chemotaxis (migrated cells/field) of WT cells treated with vehicle or SKI-606. Error bars, S.E. of 3 independent experiments. *, p<0.02. E, IFA analysis of Frabin and F-actin in KO MEF treated with SKI-606. Scale bar, 10 µm. Arrow, chemotaxis direction. F, Chemotaxis of KO MEF transfected with vector (–) or CA-PI3K and/or treated with SKI-606. Error bars, S.E. of 3 independent experiments. *, p<0.02; n.s., not significant. G, IFA analysis of GFP or Frabin in KO MEF transfected with pEGFP and CA-PI3K and then treated with vehicle or SKI-606. Scale bar, 10 µm. Arrow, chemotaxis direction. H, KO MEF transiently transfected with pEGFP alone or with plasmids encoding CA-PI3K or ΔSrc-SSeCKS, were treated with either vehicle or SKI-606 (1 µM) for 18 h, then subjected to directional chemotaxis assays, fixed and stained for F-actin. Arrows, chemotactic direction.

