
Figure 1.
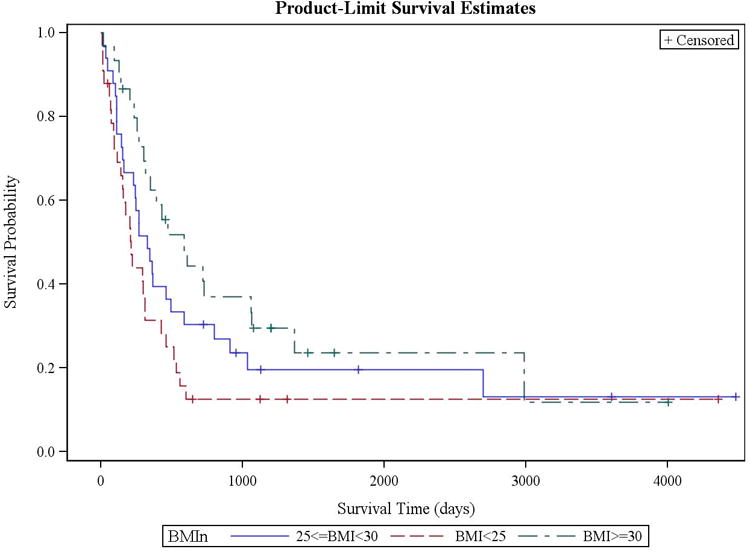
Kaplan-Meier estimation of overall survival by patient BMI among patients over 60 years old. Overall survival differed between patients based on BMI. BMI < 25 (red dashed line) was associated with a worsened OS compared to BMI between 25 and 30 (blue solid line), and with BMI of ≥ 30 (green dashed line) (p=0.039).