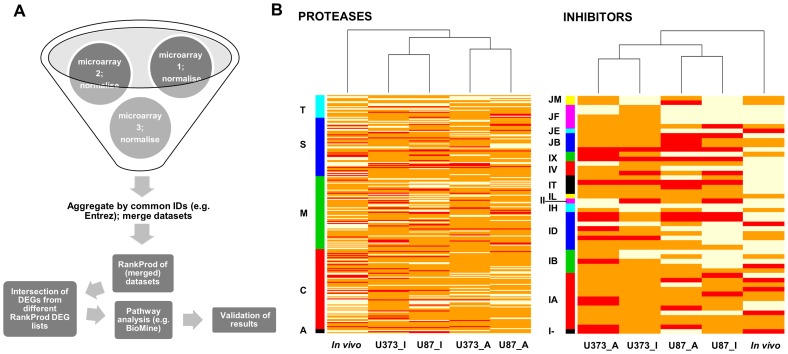
Figure 1. Analysis pipeline (A) and heatmap of differentially-expressed protease and protease inhibitor genes in GBM tissues (in vivo) and U373 and U87 cell lines (B).
(A) Data from different sources and platforms were integrated after quality control and normalization that were performed separately for each microarray dataset and were converted to a defined identifier (Entrez gene ID). Probes with the same Entrez gene ID were aggregated and averaged and datasets merged with keeping only data when an identifier was found across all microarrays. Differentially-expressed genes were identified by the nonparametric RankProd method applied to merged data and searched for the intersection with a list of proteases and protease inhibitors genes. Hierarchical clustering was done in R statistical software using default parameters (complete linkage method). Afterwards, pathway analysis was performed to assist the biological interpretation of results and the selected candidate genes were validated by molecular biology tools. (B) Heatmap showing differential expression of protease and protease inhibitor genes in GBM tissues as compared to non-malignant brain tissue (in vivo) versus two GBM-derived cell lines as compared to NHA cell line. Legend: U87_I, U373_I - data for U87-MG and U373 cell line obtained from Illumina microarray; U87_A, U373_A - data for U87-MG and U373 cell line obtained from Affymetriy microarray; T - threonine proteases, S - serine proteases, M - metalloproteases, C - cysteine proteases, A - aspartic proteases; JM, JF, JE, JB, IX, IV, IT, IL, II, IH, ID, IB, IA, I- - clans of protease inhibitors.

