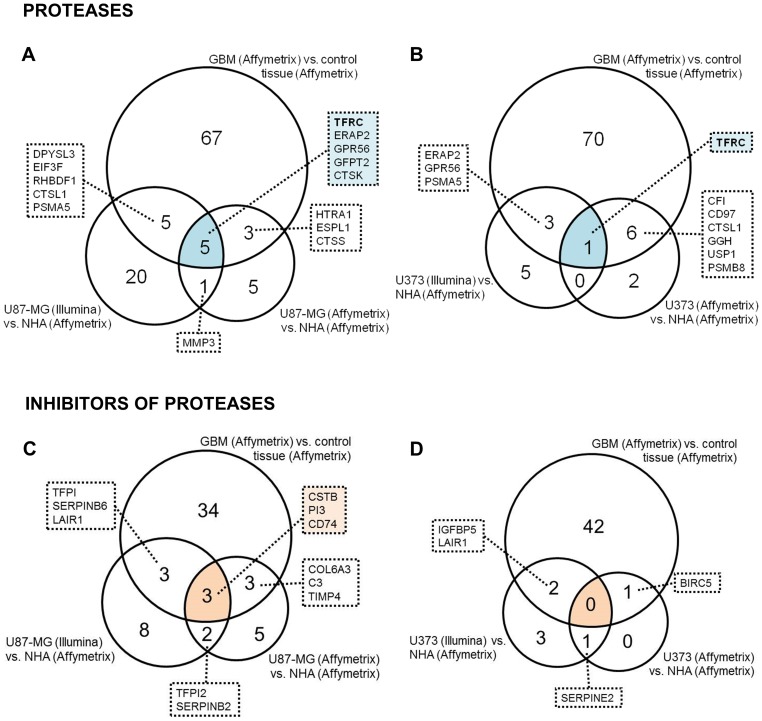
Figure 2. Venn diagrams of protease and protease inhibitor genes upregulated in both GBM tissue and GBM cells.
In total, 669 protease and 242 protease inhibitor genes were checked for deregulation in GBM tissues and cells in comparison to non-malignant brain tissue and NHA cells. Venn diagrams include upregulated genes in GBM tissues and cells with PFP >0.05. Candidate genes appear in the intersections of Venn diagrams. Comparisons of protease genes upregulated in GBM tissue and in U87-MG cells (A) and upregulated in GBM tissue and in U373 cells (B) across Illumina and Affymetrx platforms and within the Affymetrix platform only are shown. The other 2 Venn diagrams show comparisons of protease inhibitor genes upregulated in GBM and in U87-MG cells (C) and upregulated in GBM and in U373 cells (D) across Illumina and Affymetrx platforms and within the Affymetrix platform only.

