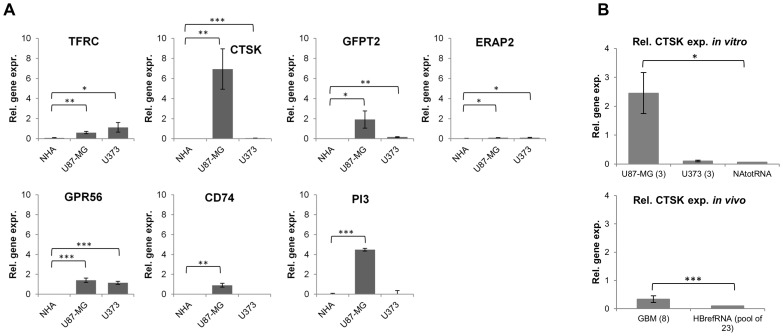
Figure 3. RT-qPCR analysis of expression of selected proteases and protease inhibitors in U87-MG and U373 GBM cells, NHA cells and GBM tissues and non-malignant brain (in vivo).
(A) Upregulated expression of seven genes (TFRC, CTSK, GFPT2, ERAP2, GPR56, CD74, PI3) as determined by microarray data was validated in GBM cells in comparison to NHA cells by RT-qPCR, using GAPDH as reference gene. (B) Additional RT-qPCR analysis of expression of the CTSK gene using GBM tissues and cell lines with reference genes TBP and HPRT1 in comparison to NHA cells (NAtotRNA) and non-malignant brain (HBrefRNA). The experiments were performed in triplicate (except for 8 repetitions of GBM tissue and commercial RNA from NHA and normal brain, used in experiment B). Error bars represent standard deviation; * p-value<0.05, ** p-value<0.01, *** p-value<0.001.

