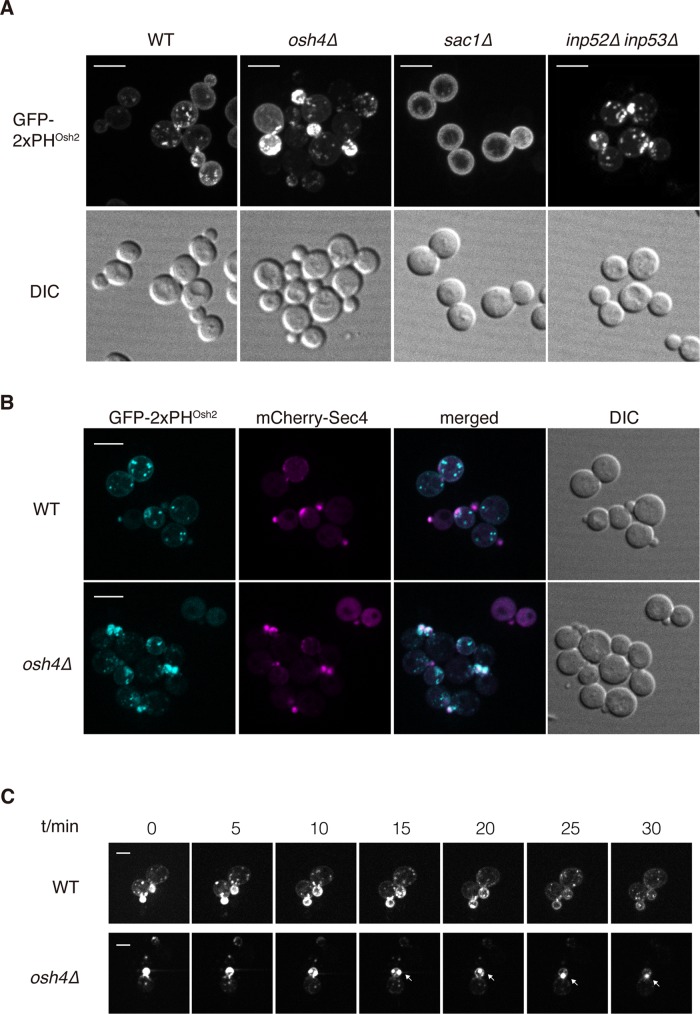
FIGURE 4:
Osh4 regulates PI4P distribution and dynamics in cells. (A) Localization of the PI4P probe GFP-2xPHOsh2 in wild-type, osh4Δ, sac1Δ, and inp52Δ inp53Δ cells. Cells shown are representative of >100 cells observed. Scale bar, 5 μm. (B) Localization of the PI4P probe GFP-2xPHOsh2 and mCherry-Sec4 in wild-type and osh4Δ cells. Cells shown are representative of >100 cells observed. Scale bar, 5 μm. (C) PI4P dynamics in wild-type and osh4Δ cells. Cells expressing GFP-2xPHOsh2 were examined by time-lapse fluorescence microscopy. Images are shown at indicated time points. Arrows indicate that GFP-2xPHOsh2 accumulated at polarized growth sites. Scale bar, 2 μm.

