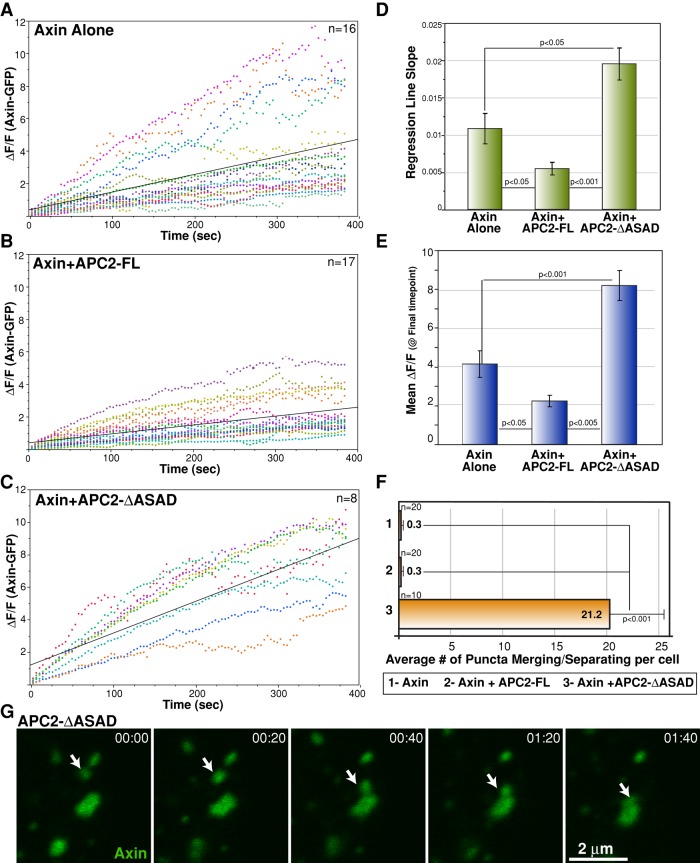
FIGURE 5:
APC2 self-association stabilizes the destructosome. (A–C) Plots of ΔF/F for each condition. Similar-sized Axin-GFP puncta were selected, and the recovery of individual bleached spots is shown in unique colors for each condition. Black lines are regression lines. Regression analysis indicates that the relationship between time and fluorescence varies by condition. ANOVA for regression lines, p < 0.0001; Tukey–Kramer HSD posthoc test for each pair, p < 0.05. (D) To compare the rate of recovery, we calculated the slope of the regression line for each individual sample and compared the means of these slopes for each condition. Means are plotted with SEM whiskers; Tukey–Kramer HSD posthoc test for each pair, p < 0.05. (E) To compare the difference in mobile and immobile fractions at the end of the experiment, time-zero normalized degree of recovery at our last time point (384.12 s) for the three conditions was determined. Means are plotted with SEM whiskers; Tukey–Kramer HSD posthoc test for each pair, p < 0.05. (F) We observed a significant difference in the number of puncta merging and separating events (a measure of puncta dynamics) between Axin-GFP/APC2-ΔASAD puncta compared with Axin-GFP or Axin-GFP/APC2-FL puncta. This behavior is rarely observed in Axin-GFP and Axin-GFP/APC2-FL puncta. Scale bar, 2 μm. Student's t test, p < 0.001 between the mutant and either of the other conditions. (G) Axin-GFP/APC2-ΔASAD puncta are highly dynamic. The white arrow tracks the merging of two puncta. Time stamp in minutes:seconds.

