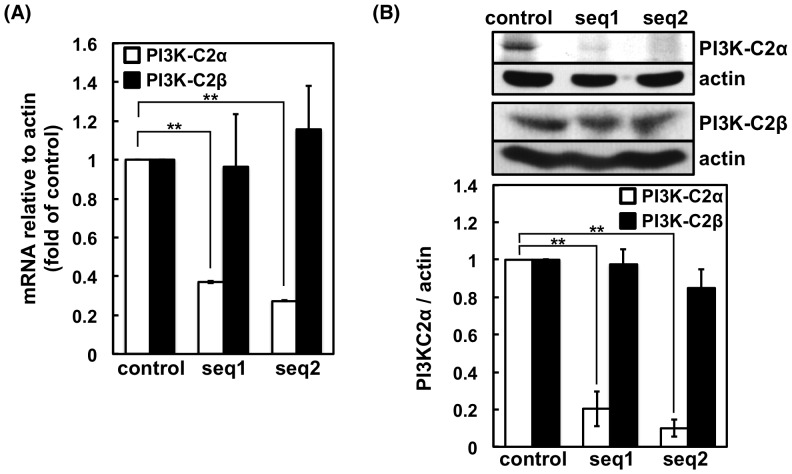
Figure 1. mRNA and protein expression levels of PI3K-C2α in control and shRNA-transfected RBL-2H3 cells.
(A) Real-time PCR analysis of PI3K-C2α and PI3K-C2β in cells transfected with the control or shRNA expression vector. The mRNA levels are normalized against that of actin, and values relative to those of the control cells are shown as the means ± s.d. (n = 4). (B) Western blotting analysis of PI3K-C2α in cells transfected with control or shRNA expression vector. Representative blots from four separate experiments are shown. The protein expression levels are normalized against that of actin, and values relative to those of the control cells are shown as the means ± s.d. (n = 4).

